2014-The 8th ASEAN-China Forum on Social Development and Poverty Reduction1
PREFACE
It is the common concern of China and ASEAN countries to establish a peaceful, prosperous and stable China - ASEAN relationship, especially to work together for poverty eradication. "China -ASEAN Forum on Social Development and Poverty Reduction" aims at promoting the multidimensional poverty eradication of China and ASEAN, boosting human development and providing a platform for exchange and cooperation in regional poverty reduction. This is the keynote report of the Eighth "China - ASEAN Forum on Social Development and Poverty Reduction – Deepening China – ASEAN Cooperation in Regional Poverty Reduction".
The forum promotes more inclusive development and pro-poor growth to cope with the challenge of regional poverty reduction.Growth benefits the poor through its "trickle-down effect". However, not all economic growth has a direct poverty reduction effect. Income inequality or unequal opportunities are both likely to have an impact on the development of the poor, thus further affecting the poverty reduction effects of economic growth. Inclusive growth puts more emphasis on the development process, while the concept pays more attention to integrating and supporting theambitious goal of "human development". In the 12th Five-year Development Plan (2011-2015), the Chinese government stresses the important position of "inclusive growth" in the domestic development and international relations. Meanwhile, and puts greater emphasis on the pro-poor growth to benefit the poor through the reform of income redistribution. ASEAN countries have also made positive exploration in promoting inclusive development and pro-poor growth. Inclusive growth needs to include the poor into the process of economic development and implement the policies to promote the inclusive development of participation, cooperation and collaboration. It means poverty reduction is the core of the inclusive development policy, and indicates that in order to achieve this target; we need the support of economic development policies and various kinds of cooperation between countries.
The forum advocates deepening China - ASEAN cooperation in poverty reduction and establishing a more harmonious, prosperous and tolerant China - ASEAN relationship. Since the establishment of their dialogue relationship in 1991, China and ASEAN countries have conducted cooperation in political, economic, social and cultural fields and constantly expanded the areas of cooperation. Cooperation in regional poverty reduction has also been formally incorporated into the "Plan of Action to Implement the Joint Declaration on ASEAN-China Strategic Partnership for Peace and Prosperity (2011-2015)", becoming an important part of China – ASEAN cooperation.
Before 2005, it was the main goal of deepening China - ASEAN cooperation in poverty reduction to achieve the UN Millennium Development Goals. In order to promote the realization of the UN Millennium Development Goals and eradicate poverty, hunger, disease, illiteracy, environmental degradation and discrimination against women, while striving to achieve the domestic poverty reduction objectives, China and the ASEAN countries actively promoted South-South cooperation. In particular, the first "China - ASEAN Forum on Social Development and Poverty Reduction" was successfully held in Nanning of China in 2007. The establishment of this mechanism provided a platform for the policy makers, theorists and development practitioners of ASEAN countries and China to share social development and poverty reduction policies and experience.
The forum advocates the establishment of a more inclusive China - ASEAN cooperation in investment, trade and aid. As of the end of June 2013, the bilateral investment between China and ASEAN totaled $ 100.7 billion and ASEAN became the fourth largest economy of China's foreign direct investment, surpassing Australia, the United States and Russia. At the same time, ASEAN expanded the scale of its investment in China. Now, China has become ASEAN's fourth largest source of foreign investment. In 2010, China-ASEAN Free Trade Area (CAFTA) was successfully set up on schedule, which promoted the trading activities between the two major economies with GDP up to 6 trillion yuan, covering 11 countries and 1.9 billion people, making trade activities between China and ASEAN account for 13% of the world's total. CAFTA is the largest free trade zone not only in developing countries, but even in the whole world. The establishment and development of the trade partnership between the two made a great contribution to total economic growth and poverty reduction. In addition, through the economic cooperation mechanism, preferential loans and volunteers for foreign aid, China has provided a lot of financial and technical assistance for ASEAN countries and dispatched relevant experts and technicians to share operation management experience and techniques with them. Through China – ASEAN cooperation in investment, trade and aid, while enhancing the relevant countries’ strategy and policy formulation and implementation capabilities, we’ve made tremendous efforts to enable more poor people to share the outcomes of regional cooperation in order to create a harmonious, inclusive China - ASEAN community of destiny for sustainable development.
The forum advocates working together to respond to the new challenges for regional poverty reduction. Poverty reduction and development cooperation between China and ASEAN countries are still confronted with many constraints and challenges. These challenges include but are not limited to the new challenges for poverty reduction brought by economic transformation and the upgrading of industrial structure; problems in the process of urbanization, such as the lack of equality, social exclusion and other problems that the inclusive development framework is committed to address, etc. In many countries of Southeast Asia, for example, due to the insufficient accommodation capacity of cities, the phenomenon of "slums" occurred in the cities with poor life quality and high child mortality. In 2010, the proportion of the slums in Southeast Asia (especially in Laos, Cambodia and Myanmar) was 31%. Cities cannot meet residents’ needs for safe drinking water and health facilities. In addition, there are problems of environmental pollution and climate change, etc. Therefore, it is essencial to deepen China - ASEAN cooperation in regional poverty reduction, share development experience and explore new poverty reduction models to cope with challenges.
Themed "Deepening China - ASEAN Cooperation in Regional Poverty Reduction", the forum will analyze the new challenges for poverty reduction and inclusive growth of both sides. This report is prepared to provide discussion material for the Eighth China - ASEAN Forum on Social Development and Poverty Reduction. Through this report and the participants’ in-depth discussion on the forum topic and practice and experience sharing with one another in the field of poverty reduction and inclusive growth, this event is expected to accelerate the establishment of a new partnership for poverty reduction and promote the poverty reduction and social development in China and ASEAN countries.
The authors of the thematic report: Introduction, Dr. YU Man; Chapter I, Urbanization and Urban Poverty in Southeast Asia Dr. LIU Qianqian, Dr. YU Man, (International Poverty Reduction Center in China); Chapter II, Indonesia’s Poverty Reduction Practice, Dr. ZHANG, Jianlun, QIU, Liyu, Dr FENG, Hexia; Chapter III, Cambodia’s Poverty Reduction Practice WANG, Erfeng YANG, Yanran Dr. XIAO, Pinghui; Chapter IV, Industrial Structural Upgrading and Poverty Reduction in China, Prof. LIN, Yifu, Prof. YU, Miaojie, (Peking University); Chapter V, Primary Analysis of the Direct Subsidy Policies to Farmers in China and Its Input Level Since 2001, Prof. LIN, Wanlong ; RU, Yu(China Agricultural University); Chapter VI, China-ASEAN Cooperation in Development Assistance, WANG, Luo (Institute of International Development Cooperation, Chinese Academy of International Trade and Economic Cooperation, Ministry of Commerce, PRC); Chapter VII, China-ASEAN Relations in the context of Inclusive Development , Dr. LIU, Qianqian, Dr. WANG, Xiaolin, (International Poverty Reduction Center in China). Cover Design, ZHAO Qingqing, GAO Rui; Composing, SHI Xinyan; Compiling Editor, WANG Xiaolin.
CHAPTER 1 URBANIZATION AND URBAN POVERTY IN
SOUTHEAST ASIA
LIU Qianqian YU Man
In the 1960s and 1970s, the economy of Southeast Asian countries began to take off. With the development of industrialization, the Southeast Asia gradually set off a wave of urbanization. After decades of development, the level of urbanization in Southeast Asian countries has been significantly enhanced. Urbanization means changes in the economic and social structure. It enhanced the living standards while creating more employment opportunities, improved the productivity through pooling scarce resources and boosted economic growth, thereby reducing poverty. However, urbanization itself does not mean a process of equal distribution of wealth. Different from the traditional poverty, the challenges brought about by rapid urbanization are multidimensional and development problems arising from insufficient urban carrying capacity and infrastructure and the lack of public services in the context of the transfer of a large number of people to the city within a short time, such as the health, education and deteriorating living environment of urban residents. The world's urbanization rate has reached 54% (UN, 2014), but the problem of urban poverty is becoming increasingly severe.
Now, we’ll analyze urbanization and urban poverty by giving examples of Southeast Asian countries.
1. OVERVIEW OF URBANIZATION IN SOUTHEAST ASIA
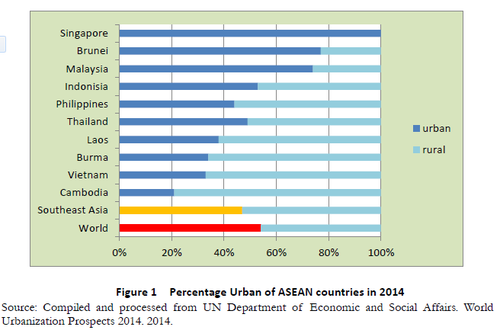
There are significant imbalances in the urbanization levels reached by the different Southeast Asian countries, as clearly shown in Figure 1. Southeast Asian countries can be placed in three categories of urbanization. The first group is countries with relatively high levels of urbanization, including Singapore, Brunei and Malaysia. The urbanization rate of these countries is over 70%. In particular, the urbanization rate of Singapore reached 100% as early as 1960. The second group is countries with moderate levels of urbanization, including Indonesia and the Philippines, with urbanization rates between 40% and 60%. The urbanization rates of Indonesia and the Philippines were 50.7% and 48.8% respectively in 2011, both approximating the world average of 52.1% urbanization1. The third category comprises countries with low levels of urbanization, including Cambodia, Laos, Myanmar, Vietnam and Thailand, with urbanization rates between 20% and 40%, significantly lower than world average.
1 UN Department of Economic and Social Affairs. World Urbanization Prospects 2011. 2012. (Online database)
1. 1 HISTORICAL STAGES OF URBANIZATION IN SOUTHEAST ASIA
The urbanization process in Southeast Asia can be divided into three stages. The first stage was between the 1950s and 1960s, when urbanization was in its initial development. One after another, Malaysia, the Philippines and Indonesia developed industrialization-focused economic growth plans.
For instance, Indonesia devised the industrialization-focused ‘Eight-Year Plan for Comprehensive Development’ and Thailand promulgated the ‘Regulations on Industry Investment Incentives’. Booming industrialization facilitated the process of urbanization. Rapid development of secondary and tertiary industries enabled tides of rural residents to migrate to cities. Populations in countries such as Malaysia and Thailand began to explode.
The second stage was between the 1970s and early 1990s when both urbanization and the economies in Southeast Asia were experiencing rapid development. Due to favorable government policies, industry represented a large proportion of the GDP of many Southeast Asian countries, and most industrial investments concentrated in cities. With the rapid increase in city dwellers and rural-urban migration, urbanization continued at a frenzied pace.
The third stage continues from the 1990s through today, where urbanization is experiencing steady development. Southeast Asian countries are no longer in the single-minded pursuit of rapid economic growth. Instead, they seek sustainable development through economic policies.
1. 2 MAJOR CHARACTERISTICS OF URBANIZATION IN SOUTHEAST ASIA
By observing its historical development, urbanization in Southeast Asian countries has the following characteristics:
1. 2.1 THE GROWTH RATE OF URBANIZATION IN SOUTHEAST ASIA WAS
HIGH.
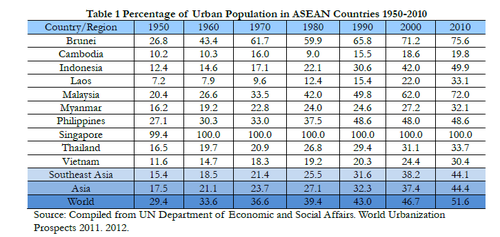
Since the 1960s, Southeast Asia has been experiencing an urban population explosion and rapid urban development. In the 1960s, the overall urbanization level was only 18.5%. That figure increased to 25.5% in 1980, 38.2% in 2000 and 44.1% in 2010 (Table 1).
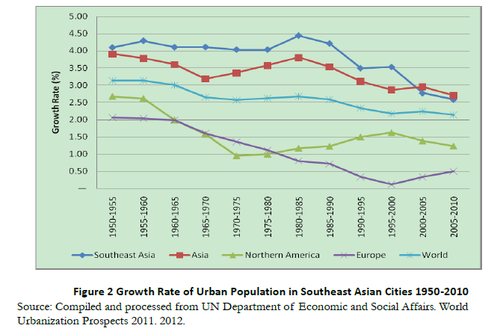
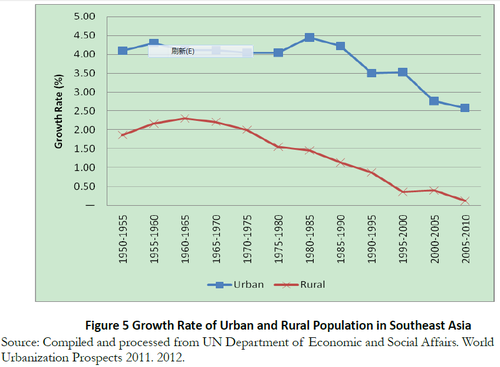
Figure 2 reveals the changes in the growth rate of urban population over the years. It is notablethat the growth rate of the urban population in Southeast Asia was higher than that of the world average. Before 2000, the growth rate was 3.5%, more than double that of world average. Horizontally, the growth of the urban population in Southeast Asia was faster than that of Europe and North America and that of the Asian average between 2000 and 2005. In 2000, population growth began to slow, slower than Asian average yet faster than other regions in the world. Correspondingly, the growth rate of urbanization in Southeast Asia followed the same pattern between 1950 and 2010 (Figure 3).
On the whole, Southeast Asia is urbanizing rapidly, but the level of urbanization varies from country to country. As early as the 1990s, Singapore realized 100% urbanization. In the 1950s and 1960s, Thailand’s urbanization level was higher than that of Indonesia (Table 1). After decades of remarkable development, by 2010, the urbanization level of Indonesia had surpassed that of Thailand, at 50% and 30% respectively. Meanwhile, other countries such as Cambodia not only have a low level of urbanization, but also have a slow urbanization growth rate. Cambodia’s urbanization rate only saw slight increase over the last 60 years, from 10.2% in the 1950s to 19.8% in 2010.
There are several factors contributing to the differences between these Southeast Asian countries.First, there are differences in population size, geographical location and resource endowment. Second, there are differences in their respective levels of economic growth and industrialization. Southeast Asia includes developed countries such as Singapore and Brunei, middle-income countries such as the Philippines and Indonesia and also includes less developed ASEAN countries such as Vietnam, Laos, Cambodia and Myanmar. Industrialization is an important driving force for urbanization, thus varying levels of industrialization reflect varying levels of urbanization. For instance, in the late 1980s,Singapore’s manufacturing output per capita of exceeded $3,000, while Laos was yet to start the industrialization process. Third, Southeast Asian countries have different political and social environments. Political stability is a key external pre-condition for urbanization. War and political turmoil hindered economic development and urbanization in Vietnam and Laos, while by contrast,Singapore enjoyed political stability.
1. 2.2 THE URBANIZATION LEVEL OF SOUTHEAST ASIAN COUNTRIES IS
RELATIVELY LOW.
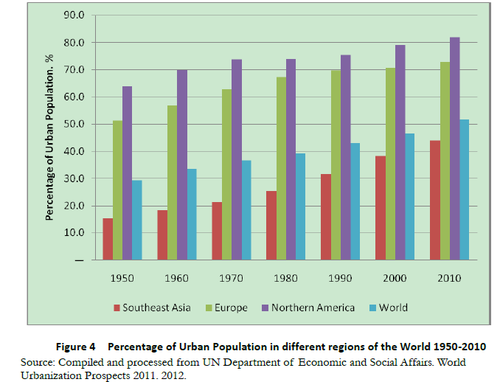
Despite their rapid urbanization growth rate at one stage or another, horizontally, the urbanization level of Southeast Asia is lower than that of other developed countries or regions, and even lower than that of world average (Figure 4). As early as the 1960s, the urbanization level of North America and Europe neared 70% and 57% respectively. By 2010, the average urbanization level of Southeast Asia had been still lower than that of Europe (72.7%) and North America (82%)2.
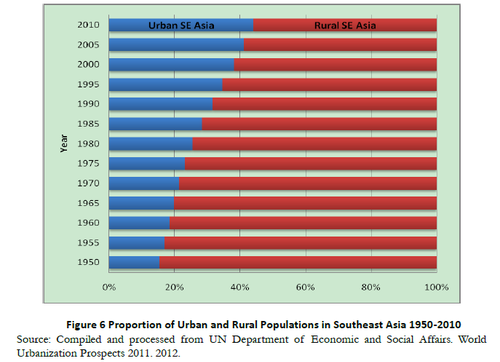
The major reason for the lower urbanization level in Southeast Asia compared to other developed countries is not due to a slow urbanization growth rate, as shown in the chart above, but to a large extent, is of the imbalance between urban and rural populations. The growth rate of the urban population in Southeast Asia is higher than growth rate of the rural population (Figure 5). However, due to a large base of rural residents, population growth is concentrated in rural areas (Figure 6). In 2011, among a population of 600 million in Southeast Asia, 332 million were rural3, accounting for 55. 3% of the total. Undoubtedly, that made the expansion of urbanization difficult, hence a small share of urban population (low level of urbanization).
1. 2.3 URBAN POPULATIONS AND ECONOMIC ACTIVITIES TENDED TO
BE HEAVILY CONCENTRATED IN THE CAPITAL CITIES IN SOUTHEAST
ASIA.
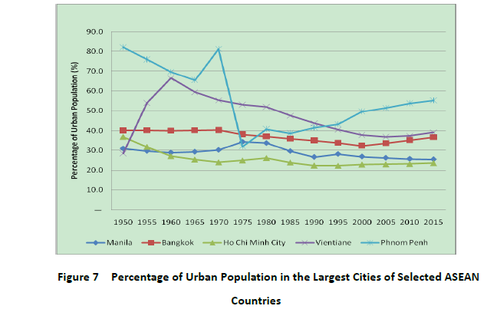
The over-concentration of the urban population and economic activities in capital cities is a distinctive feature of urbanization in Southeast Asian countries. The capital cities of Southeast Asian countries tend to be the largest city in the country, such as Jakarta (Indonesia), Kuala Lumpur (Malaysia), Bangkok (Thailand), Manila (the Philippines), Ho Chi Minh City (Vietnam), and Phnom Penh (Cambodia). On top of this, capital city dwellers represent a large share of the total population in urban areas (Figure 7), a share large in Asia let alone the world. According to statistics, the population of Phnom Penh accounted for 81.2% and 53.9%12 of the total Cambodian population in 1970 and 2010 respectively. The populations of Vientiane and Bangkok exceeded one third of the total population of their respective countries (37.3% and 35.2%) in 20104. The populations of capital cities also tend to also be much higher than the population of the second largest city of that country.
For instance, in 1970, the population of Bangkok was 33 times that of Changmai, the second largest city in Thailand. After decades of population expansion in Bangkok, there were 8.38 million people living there in 2010, while only 150,000 lived in Changmai. In other words, the population in Bangkok was 55 times that of Changmai5. Capital cities are not only the largest city in those countries but also their political, economic and commercial center.
The over-concentration of population in capital cities can be explained by their production capacity and economic structure. Take Bangkok as an example. Bangkok has developed into the economic center and outbound investment hub of Thailand since the beginning of the last century.
In 2010, with a population 10% of the total Thai population, Bangkok created $98.3 billion of economic output, accounting for 29.1% of the national total6. Half of the country’s tertiary sectors are concentrated in Bangkok. It is also the largest car-manufacturing base in Southeast Asia7. The most important commercial and financial center of Thailand is in Bangkok. By contrast, other regions in Thailand lag far behind Bangkok and stand in striking contrast. Manila represents 15% of the total population of the Philippines, but it contributes 75% of the industrial output to the national total. The dramatic regional differences result in a polarized economic structure between the capital cities and other cities in Southeast Asia.
2. URBANIZATION AND POVERTY IN SOUTHEAST ASIA
2. 1 URBANIZATION, ECONOMIC DEVELOPMENT AND POVERTY
REDUCTION
Urbanization is conducive to economic growth, and sustainable economic growth is key to poverty reduction. The more urbanized a country is, the more investment and businesses it will attract.
In that sense, urbanization is beneficial to development, especially economic development.
Urbanization delivers many job opportunities and therefore attracts many rural migrants. For the poor, especially the poor from rural areas, cities represent more job opportunities, better lives and a way out of poverty.
However, will urbanization definitely reduce poverty? The answer could depend on how to measure ‘poverty’ and how to understand the relationship between society as a whole and individuals.
If poverty is merely measured by income, the development of urbanization definitely causes an increase of income. In this sense, urbanization is helpful for poverty reduction in the city. However, according to Amartya Sen, poverty is multi-dimensional. Poverty does not merely mean an extremely low level of income, but also deprivation of opportunities and loss of rights8. When the city cannot create more new job opportunities for the new comers, deeper inequality, growing unemployment and a poorer urban population will appear. Urbanization does not necessarily mean equal opportunity of everyone. For instance, the underclass and the poor often lack knowledge and skills, so they cannot easily get the equal job opportunities in the city as other people who are well educated. For the poor, city life might even mean living in a worse environment, loss and deprivation of rights and social exclusion. While urbanization could be a driving force for development and poverty elimination, it also has the potential risk to lead to new poverty.
2. 2 URBANIZATION AND CAUSES OF URBAN POVERTY IN SOUTHEAST
ASIA
Many studies indicate that urban poverty is more evident in the megacities of Southeast Asian countries. In theory, the larger concentrations of population in megacities should benefit from economies of scale9. Development of megacities can promote economic growth and exert a positive impact on the economy and urbanization of the surrounding areas. The larger a city is, the more positive an impact it will have. Southeast Asian countries have adopted the strategy of driving national urbanization by focusing on the development of megacities, which is one reason why urbanization is so concentrated in capital cities. For instance, industrial activities are mostly concentrated in Bangkok, even to the point of saturation.
On the policy level, Southeast Asian governments generally focus more on the development of a particular city while neglecting the development of other regions, especially the rural areas. They make megacities the center of attraction, leading to a massive influx of rural migrants. To some extent, rural-urban migration is one of the reasons why Southeast Asia has been undergoing rapid urbanization. It is notable that the massive influx of rural migrants into cities is not entirely because the cities have enough capacity to provide jobs, but largely because the huge differences between urban development and rural development. In other words, the big push factor for urban population expansion results from economic depression and recession in rural areas.
The massive tide of rural migrants results in the rapid expansion and explosion of urban populations. However, the rate of migration is often much faster than the rate of urbanization and industrialization of the cities. Sometimes the number of migrants is far beyond the carrying capacity of the cities. Cities cannot provide enough infrastructure, public service and job opportunities to rural migrants, many of whom fall into poverty. Many Southeast Asian countries show such undesirable urbanization patterns, especially the Philippines and Thailand.
This extremely unbalanced urbanization puts intense pressure on cities, and in itself is at the expense of agriculture and rural development. It causes a loss of a rural workforce and limits continued development of rural areas.
2. 3 URBAN POVERTY IN SOUTHEAST ASIA
Many studies in recent years indicate that measuring urban poverty only by income is too narrow a definition, because too many inequalities leading to poverty are neglected. According to the theory of multi-dimensional poverty, early death, malnutrition and low level of education can all be seen as deprivation of basic human capability, which can also be understood as a kind of poverty10. From that perspective, urban poverty can be understood as insufficient income, a lack of job and schooling opportunities and equal access to social security systems as well as existence of many slums in the city.
In this article, we will examine urban poverty in Southeast Asia from the perspective of multi-dimensional poverty.
2. 3.1 INCOME AND URBAN POVERTY
Southeast Asian countries have made tremendous achievements in reducing income poverty. But over one fifth of the population lives below the poverty line ($1.25/day). In the entire Asia-Pacific region, Southeast Asia still has a relatively high poverty headcount ratio. In 2011, the ratio was 21%, only lower than that of South Asia and Southwest Asia (36%). By 2010, nearly 10% of Indonesians lived below the national poverty line11.
Income inequality is very prevalent in many Southeast Asian cities. Among the 35 most unequal cities in the developing world, five are Southeast Asian cities. The Gini coefficients of Bangkok, Ho Chi Minh City, Kuala Lumpur and Manila are 0.48, 0.53, 0.41 and 0.4 respectively12, all surpassing the international warning line.
Because the rate of job creation is much lower than the rate of urban population growth, the unemployment rate and the rate of employment in informal sectors in Southeast Asian cities are much higher than those of cities in the developed world. The unemployment rate in Manila is the highest (11.8%) while the nationwide average is 7.1%13. In Jakarta, Indonesia, 11.9% of people were unemployed in 2008. Many migrants, especially female migrants, have to work in informal sectors that do not provide medical insurance or labor security. In 2002, 64.9% of female Vietnamese worked in informal sectors in cities. 51.3% of female Filipinas worked in informal sectors while only 7.3% male Filipinos worked in the same sectors14.
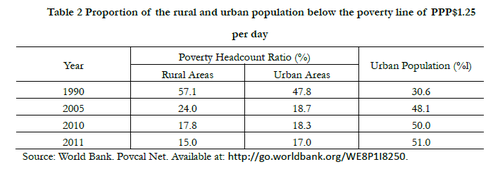
Will urbanization play a positive role in reducing poverty ? As the poverty standard of $ 1.25 a day is used for measurement, the answer seems to be yes. Take Indonesia as an example, 47.8% of the urban residents and 57.1% of the rural residents lived below the poverty line of 1.25 a day in 1990. In 2005, however, the proportion of the urban residents living below the poverty line was significantly reduced to 18.7%, much lower than that of rural residents (Table 2). We noted that the reason why the poverty situation in rural areas is more severe than that in urban areas is the rural residents in the Southeast Asian region account for a relatively high proportion and the rural poverty rate is usually higher than the incidence of poverty in urban areas. In this sense, it takes a shorter time to reduce urban poverty. In 2010, however, the situation changed significantly and the urban poverty rate in Indonesia was higher than the rural incidence of poverty, up to 18.3%. In 2011, the number of its poverty-stricken urban residents declined to some extent compared to the previous year, but the proportion of urban residents living in poverty was still higher than that of the rural poor.
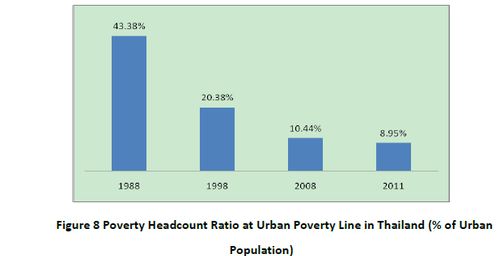
If we use the urban poverty line as the measure of poverty, we can see similar trends in other Southeast Asian countries. In 1988, over 43% of urban Thai lived below the urban poverty line. A decade later, the figure was almost halved (20.4%). In 2011, only less than 9% lived below the urban poverty line. In addition, the percentage of urban poor in Cambodia was reduced from 21.1% in 1997 11.8% in 200715.
Moreover, apart from urban-rural disparity, regional divisions, especially between megacities and remote areas, is evident in many Southeast Asian countries. From the Thailand Millennium Development Goals Report 2009 submitted to the UN by the Office of the National Economic and Social Development Board, the poverty rate of northeast Thailand was much higher than that of other Thai regions, followed by the north, the south and the central regions. The poverty rate of Bangkok, in central Thailand, had the lowest poverty rate in the country in 200916.
The poverty gap index estimates the depth of poverty by considering how far, on the average, the poor are from a poverty line. In most Southeast Asian countries, by the standards of an urban poverty line, the poverty gap has narrowed. For example, the urban poverty gap index in Malaysia dropped from 0.5% in 2004 to 0.3% in 2009. In Indonesia it dropped from 2.3% in 2004 to 1.3% in
15 World Bank. World Development Indicators 2013.2013. Available at http://data.worldbank.org/country. [accessed on 13
May 2013]
16 Office of the National Economic and Social Development Board. Thailand Millennium Development Goals Report
2009. July 2010. Available at: http://www.undp.or.th/resources/documents/Thailand_MDGReport_2009.pdf.
[Accessed on 19 May 2013].
2013.
2. 3.2 EDUCATION AND URBAN POVERTY
With rapid industrialization and urbanization, many rural working-age people migrate to cities. But because of poor educational facilities, education level indicators of some Southeast Asian populations are much lower than that of populations in the developed world. The enrollment rate of urban school-age children in primary school is higher than that of their rural counterparts. This shows educational facilities in cities are better than rural areas, and proves uneven urban-rural distribution of human capital. In 2003 in the Philippines, the urban boys’ enrollment rate was 88.7% versus 89.3% for urban girls, both higher than that of their rural counterparts (84% vs 85.6%)17. Vietnam and Indonesia basically followed the same pattern.
But within cities, access to education is not equal. The poorer the family is, there is less access to education and more obvious boy-girl inequality. Take Indonesia as an example. Girls’ enrollment was lower than boys’. Enrollment of poor urban residents, especially girls from slums, was lower than the urban average and even lower than that of rural girls in 200918. Indonesian poor families are worse off in this regard. It is getting worse in recent years with enrollment of girls from slums dropping from 79.1% in 1994 to 77.4% in 1997 and to 73.1% in 200219.
This pattern is not only reflected in the enrollment rate of poor girls but also in the illiteracy rate of urban women. The illiteracy rate of women in slums is much higher than the urban average. In 2002, the average illiteracy rate of urban women in Vietnam and Indonesia was 2.7% and 2.2%, but that of women in slums was 5.4%, more than twice the urban average20.
2. 3.3 HEALTH AND URBAN POVERTY
In theory, compared to rural areas, cities enjoy better medical conditions, but in reality, that is not true. The urban poor cannot enjoy urban medical services due to the constraints of heath-care conditions, transport, environment and personal behaviors. Furthermore, urban residents are more likely to suffer from malnutrition or mental illness related to economic or life stresses compared to their rural counterparts21. In many countries, the rich-poor divide within cities is wider than that in rural areas. In many cases, the nutrition status of poor urban families is worse than that of poor rural families. Malnutrition, hunger and illness are more common in cities.
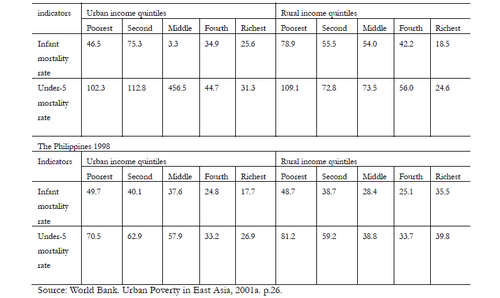
The National Demographic and Health Surveys (DHS) in Indonesia and the Philippines (Table 3) reveal that the infant mortality rate and the under-5 mortality rate of the poorest income quintile are significantly higher in urban than in rural areas. This disparity in mortality outcomes may reflect higher environmental health risks in cities. The DHS surveys also show surprisingly lower immunization coverage for measles and diphtheria, tetanus and polio in urban areas than in rural for the poorest income quintile in the Philippines22. The findings indicate that an urban advantage in access to services does not always exist, especially for poor urban residents.
In the Philippines, both infant and child mortality are somewhat worse for urban than for rural populations at the lower quintiles. Access to medically trained personnel is better in urban areas, but fees for health care in the Philippines create a significant strain on urban households. In Naga City, 68% of respondents suffer from all kinds of diseases and 57% suffer from cancer, asthma or cardiovascular disease. This is more common for poor urban residents23.
Health outcomes, especially for young children, may also reflect difficulties in nutrition. A report on the Philippines in 1999 found that 20% of the extremely poor in urban areas reported hunger in the last three months, and 11% said they felt hunger ‘always’. In Vietnam as of 1994, over one million (9%) of the total urban population could not meet the basic requirement of 2,100 calories daily.
About one-fourth of the children who were found to be malnourished lived in major cities such as Ho Chi Minh City and Hanoi24.
For Vietnam, the urban population overall reports a lower incidence of sickness (38%) than did their rural counterparts (43%) (Table 4). However, the urban poor are sick more often than the rural poor are.
Table 4 Health Status in Vietnam, by Poverty Status, Rural/Urban
Although urban residents earn more than rural residents, the former spend more on medical treatment than the latter does. Statistics reveal that urban residents, poor or non-poor, spend a greater proportion of their income on health care than the rural population. The urban poor spend almost as much on health care as the non-poor do, even though the poor would be expected to rely more on free public services. This shows a lack of government commitment to the poor.
Sexually transmitted diseases, including HIV-AIDS, are increasing rapidly in urban areas. The higher prevalence of HIV-AIDS in large urban areas (e.g. Ho Chi Minh City) as compared with smaller urban and rural areas is apparent in many countries25.
2. 3.4 WATER, SANITATION AND URBAN POVERTY
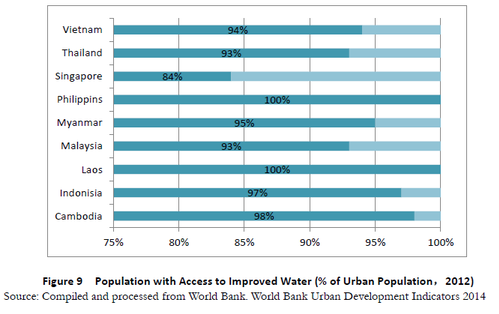
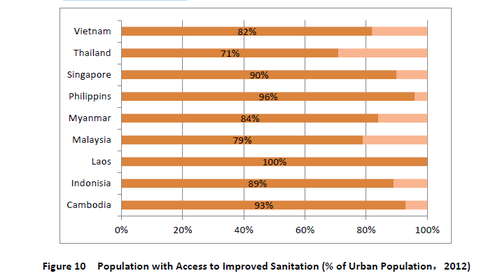
In many Southeast Asian countries, cities cannot satisfy residents’ needs for public sanitation facilities. Underinvestment in water and sewage facilities causes drinking water insecurity for many urban residents, especially for those who live in slums. World Bank statistics show that there are huge in access to safe water and sanitation facilities among Southeast Asian countries (Figure 9).
Laos, Vietnam, Myanmar and Cambodia, the four new ASEAN members, are much further behind, compared to more urbanized and industrialized countries.
Meanwhile, the ratio of urban households with access to tap water varies widely. In Phnom Penh, 86% of households have access to tap water, while the ratio is very low or even less than 50% in other locations in Cambodia. Less than one third of urban households in Indonesia use tap water26. Moreover, water supply lags far behind the demands of rapidly rising urban populations. In recent years, the percentage of urban households with access to tap water has been falling. In Jakarta, the percentage of households with access to tap water fell from 35.6% in 1997 to 29.7% in 2007. In Palembang and Medan, the access rate to tap water fell from 81.2% and 68% to 16.8% and 48.6% respectively27. The same problem exists in many cities in the Philippines and Vietnam.
Sewage treatment in most Southeast Asian countries has not reached 100 percent, but has improved in the recent decade. The percentage of homes connected to sewer lines in Manila increased to 96.7% from 92.3% in 1998, and in Ho Chi Minh City increased from 92.7% to 96.6%28. Despite the high sewage discharge rate city-wide, low-income groups and especially slum residents contribute little to that rate because of poor sanitation and inadequate government planning and investment.
2. 3.5 HOUSING AND URBAN POVERTY
Slums are generally a run-down populous area of a city characterized by substandard housing and impoverishment29. Normally, the poverty rate of cities is lower than that of the rural areas. However, living conditions within the city are vastly different, which is an important dimension of urban polarization. When we divide statistics of urban and rural areas into the statistics of rural area, urban area, slum, and non-slum, we will find that lives of slum residents are not better off than their rural counterparts in terms of non-income factors such as education and health care.
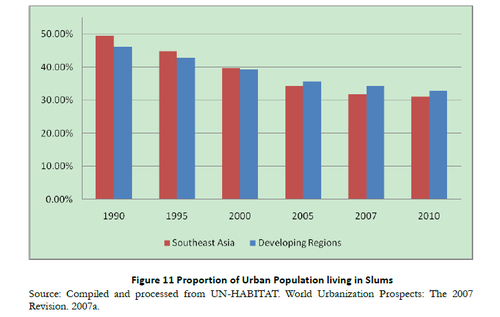
In Southeast Asia, 31% of urban population lived in slums in 2010, the second highest ratio in history30. A high ratio means poor quality of life and high mortality of children in countries with many slum dwellers, such as Laos, Cambodia and Myanmar.
Figure 11 reveals that in the early 1990s, almost half of the urban population in Southeast Asian countries lived in slums. Before 2000, the ratio of slum dwellers in Southeast Asia was higher than the average ratio of developing countries. This lasted to the beginning of this century. Since 2000, the ratio of slum dwellers in Southeast Asia has been lower than the average ratio of developing countries. On the whole, the long-term ratio of slum dwellers in Southeast Asia is decreasing.
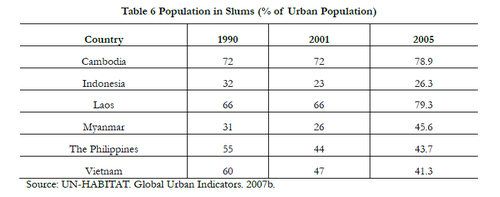
However, there is great diversity in the status of slums in each of the Southeast Asian countries. In Table 6, it shows that between 1990s and 2005, the number of slum dwellers in the Philippines and Vietnam decreased while in Myanmar, Laos and Cambodia the number increased. A higher ratio represents poor quality of life and more often than not, a high mortality of children.
2. 3.6 MULTIDIMENTIONAL POVERTY
Multidimensional Poverty Index (MPI) reflects the number of people living in multidimensional poverty (incidence of poverty, H) and the average number of deprivations suffered by each family in multidimensional poverty (deprivation degree, A).
(1) Composition of MPI
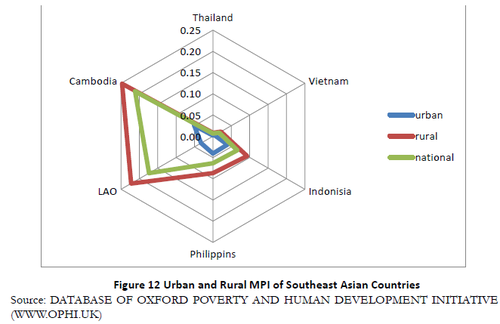
Using the MPI measurement method proposed by Alkire and Foster (AF method), from three perspectives and with 10 indicators, we measured the multidimensional poverty of six Southeast Asian countries at medium or low level of urbanization, namely Indonesia, the Philippines, Cambodia, Laos, Vietnam and Thailand, and achieved the results shown in Figure 12 below.
In these six countries, the urban MPI remain significantly lower than the rural MPI. Cambodia has the highest MPI no matter at the urban, rural or national level. That is to say, the poverty situation of this country is more serious. In 2010, its urban MPI was 0.051, urban poverty rate was 12% and deprivation intensity was 42.6%.
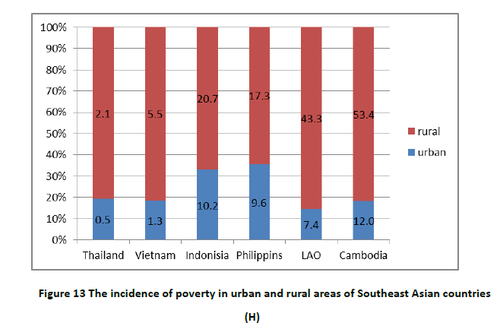
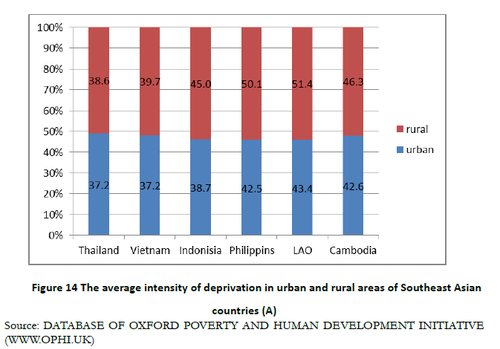
As for the two components of the Multidimensional Poverty Index, i.e. the incidence of poverty (H) and the average deprivation intensity (A), according to Figure 13 and Figure 14, Cambodia has the highest urban MPI – 12%, followed by Indonesia (10.2%). Meanwhile, we also found that the gap between urban and rural poverty incidence of Southeast Asian countries is generally large. In 2012, the multidimensional poverty incidence in rural Indonesia was 20.7%, twice the rate in urban area;
Among the six Southeast Asian countries, Indonesia had the smallest difference in poverty incidence between urban and rural areas; The multidimensional poverty incidence in rural areas of Laos was up 43. 3%, more than six times that of the urban areas. From the perspective of the average deprivation intensity (A), the average deprivation intensity of the rural poor in the Philippines and Laos both exceeds half of the dimension indicators, but the difference between urban and rural areas of these countries is not so obvious and the average deprivation intensity in urban areas is lower than that in rural areas.
(2) MPI contribution rate decomposition in urban and rural areas
After decomposing the Multidimensional Poverty Index in accordance with the indicators, we get the contribution rate of each indicator to MPI and thus help policy makers find the areas of the deprived indicators for priority intervention.
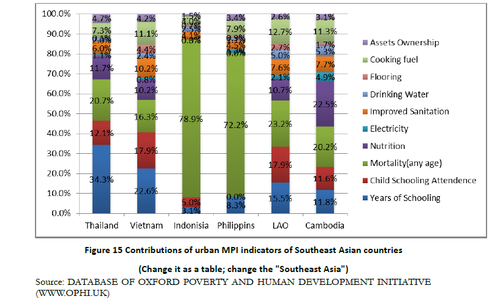
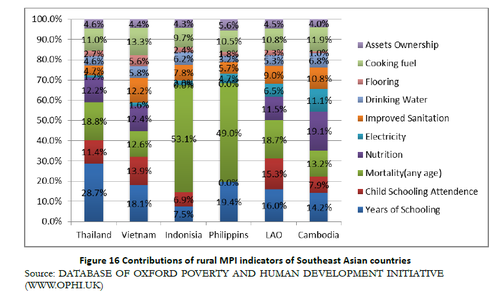
Figures 15 and Figure 16 respectively present the indicators’ contribution rates in urban and rural areas of the six Southeast Asian countries. The larger the colored area, the higher the weight of the indicator in the MPI. No matter in urban or rural areas, the mortality rate in Indonesia and the Philippines made the greatest contribution to MPI, especially in the city, Indonesia’s mortality rate contributed 78.9% to the urban multidimensional poverty, and this figure in the Philippines was also up to 72.2%.
From the perspective of the contribution of each index, in the urban multidimensional poverty, adult education in Thailand and Vietnam made the greatest contribution, respectively 34.3% and 22. 6%, followed by the mortality rate (contributed 20.7% to Thailand’s urban MPI) and child education (contributed 17.9% to Vietnam’s urban MPI). Similar situations occurred in the rural areas of these two countries.
For Cambodia and Laos, mortality rate is the indicator that made the greatest contribution to Lao’s urban MPI, followed by child education; In Cambodia, however, nutritional status contributed most to the urban MPI, followed by mortality rate, and adult education ranked third. The indicators’ contribution situation in rural Laos is similar to that in urban Laos. In Cambodia, however, adult education contributed second most to the rural MPI.
Indonesia, the Philippines and Laos, therefore, should take it as the primary task of the urban poverty reduction work in the next stage to improve the living conditions and health status of the urban poor and reduce the mortality rate of these people. Thailand and Vietnam, however, should focus on improving adult education, followed by mortality rate and child education. The most important problem facing the urban poverty in Cambodia is how to improve the nutritional status of the urban poor, followed by the improvement of the living environment and the mortality reduction. Moreover, it should strengthen the adult and children's education.
3. POLICY AND PRACTICE TO REDUCE URBAN POVERTY IN
SOUTHEAST ASIA
Urbanization should not merely aim to promote industrialization and economic growth. It should also mean the urbanization of the people, which implies to improve people’s well-being Urbanization should be people-focused. How to provide relatively equal opportunities and livable environments and how to provide the means for livelihood in the cities are issues of concern. The government should pay more attention to living conditions of vulnerable groups, respect their rights of survival and value democratic engagement in the decision-making process. Through the analysis of urban poverty in Southeast Asian countries, it can be seen that urban poverty has many causes, including poor government planning and slow urban-rural integration, limited job opportunities, uneven distribution of wealth and opportunities, inadequate provision of basic public service, and a lack of social participation. These causes imply that the role of government is crucial. In the following, some effective governmental policies and practices for urban poverty reduction in Southeast Asian countries will be discussed.
3. 1 URBANIZATION AND URBAN-RURAL INTEGRATION
Many of problems associated with urban poverty in Southeast Asia are rooted in over-concentration of population and economic activity in megacities. A healthy and sustainable process of urbanization is to balance the development of rural and urban areas. Some Southeast Asian countries have committed to developing lagging rural areas through the development of small towns. For instance, the government of Thailand initiated comprehensive rural development policies aimed at increasing the incomes of farmers and quality of life and promoting the development of small towns31. To ease population pressures on cities and transforming villages into small towns, the Thai government has established a multi-layered rural development management system, invested heavily in small town development, and developed small towns into comprehensive rural centers.
Two of Thailand’s such measures are as follows: (a) Programs for reducing rural poverty. The government tries to improve and the rural poor’s living standards through assistance of means of production, improvement of public facilities and promotion of technology. (b) Non-farming jobs creation programs. The government aims at increasing non-farming income of the farmers through government fiscal support and development of non-farming sectors. After years of efforts, the number of extremely poor villages has been significantly reduced. By narrowing the rural-urban divide through developing small towns, the pressure put on megacities by large scale rural-urban migration has been alleviated.
In order to decentralize the urban population in Thailand, the Thai government also gives tax incentives to regions outside Bangkok. By doing so, the government hoped to stimulate the development of new industry centers in Bangkok’s neighboring provinces. However, in practice, the measure was ineffectively implemented because the government failed to improve the infrastructure and supporting facilities as prerequisites of any production activities. For businesses, investing in Bangkok, the capital city with well-established infrastructure and abundant human resources, is much better an option than investing in low-tax regions. The failure of the policy measure proves how big the challenge facing Southeast Asian countries is in their endeavor to solve urban over-concentration.
3. 2 EMPLOYMENT OPPORTUNITIES IN CITIES
Urban unemployment is a serious social issue. It worsens urban poverty and triggers social instability. Unemployment of the urban poor has two distinctive features. First, the urban poor are mostly unskilled surplus labor force. Second, they generally work in informal sectors like the tertiary sector32. Engaged in informal sector activities, they tend to have low pay, unsteady jobs, and few protections against job insecurity. These two features make the employment issue more difficult to solve.
Many Southeast Asian countries facilitate employment in the urban areas by enhancing professional and skills training. Thailand spent $130 million on providing skills training to the jobless in 199833. In its first year, this policy measure helped about 140,000 people gain employment in food processing sectors. In 1994, the government of the Philippines set up the Technical Education and Skills Development Authority which has many branches in other cities besides Manila offering free training services34.
In addition, many governments in Southeast Asian countries provide the jobless with career information and consulting. The government of the Philippines established its Bureau of Local Employment to provide employment services. The Bureau is an official intermediary institution. Job seekers and employers can register with the Bureau and reach an employment agreement based on mutual intention. The government of Thailand set up a 24/7 career guidance center and spent vast amounts in building an employment information database to provide free career information and consulting to people looking for work35.
One unique measure to promote urban employment adopted by many Southeast Asian countries such as Indonesia and the Philippines is exporting the labor force overseas. For instance, the Philippines expanded its labor market in Central Asia, South Asia and Africa and exported a total of 750, 000 well-trained people overseas in 1997, alleviating the pressure of urban surplus labor force and employment and thus profiting substantially from foreign exchange earnings. In 2001, $460 million was repatriated to Indonesia by people working overseas36.
Furthermore, Southeast Asian countries have tried some other measures to help the urban unemployed find work. For instance, the Indonesian government encourages the urban unemployed originally from rural areas and those who have relatives and friends in rural areas to engage in farm work and provide those people who have returned with living subsidies and production loans37. To some extent, this measure reduces the pressure put by the unemployed on urban development.
3. 3 SLUM UPGRADING
The role of government in urbanization is limited. One approach adopted by Southeast Asian countries to transform the slums is government guidance plus participation of the private sector, community, NGOs and residents. The major strategies of slum rebuilding are slum elimination, incorporation into the overall urban development plan and slum upgrading. Compared to slum elimination, slum upgrading is more cost-effective, so it is the preferred solution for many Southeast Asian countries.
The private sector plays an irreplaceable role in infrastructure-building such as housing and slum transformation. The non-government nature and sensitivity to risks and costs make the private sector an ideal participant in developing affordable project plans. Some local governments in Southeast Asia are signing turn-key contracts with private sector firms to design plans of renovation, transformation and construction of urban housing (or slums) so as to increase efficiency and control costs. One way is to include slums and informal places of residence to local government transformation projects with market feasibility and design commercially workable projects.
Strategic Private Sector Partnerships for Urban Poverty Reduction in Metro Manila (STEP-UP) is an exemplar of public-private cooperation. National Urban Development and Housing Framework (2009-2016) (NUDHF) points out that urban housing, especially slums, are hindering urban development in the Philippines. Slums and informal housing are particular problems of urban housing. The government found that it could not satisfy the growing housing demand on its own so it adopted an innovative strategy: engaging the private sector. Government spending on housing is less than 1% of the total budget, which is the lowest in Asia38. Slum transformation programs are characterized by public-private participation. Besides government, over 200 businesses and 34 Homeowners Associations are involved. Businesses have four major responsibilities: participation in slum transformation, educational assistance, skills training and first aid training. Some of the major activities featuring business engagement are shown clearly in the column below.
Special Column Major Activities Featuring Business Engagement in STEP-UP
l Slum Transformation: AAI employees contribute 24 hours annually to house furnishing and community landscaping. GST employees take part in house construction.
l Educational Assistance: Citibank and Deutsche Bank AG made substantial donations of public school buildings. Credit Suisse provided scholarships for 20 elementary students. Some other companies offered tutorials for the children.
l Skills Training: HOLCIM, a local cement manufacturing company, upgraded painting skills of community members.
l First Aid Training: Nestle conducted free Fire Prevention & First Aid Training sessions.
Source: Steinberg, Florian. ‘Philippines: Strategic Private Sector Partnerships for Urban Poverty
Reduction in Metro Manila’, in Steinberg, Florian and Lindfield, Michael.(eds.). Inclusive Cities.
ADB.2011, p.71.
This program has upgraded 23 poor communities, improved housing conditions for 1,350 poor families and provided training sessions to 741 individuals in Manila39.
The Indonesian government has also developed many social assistance programs for the urban poor, the most important one being its National Program for Community Empowerment. It is a program that relies on the community as its driving force40. An important method for change is to empower and mobilize the community to engage in government-led transformation and improvement actions. The Program includes three parts: community empowerment, community capacity-building, provision of policies and technical support by the government. Placed at the community level, volunteer groups can help community members to design, manage and execute targeted development plans. The Program is one of the major strategies for urban poverty reduction in Indonesia. A World Bank report (2012) states that this program is a very effective approach for community participation in infrastructure building41.
4. CHALLENGES FOR POVERTY PROBLEM OF SOUTHEAST ASIAN
COUNTRIES
According to the report of the United Nations Development Programme and the Asian Development Bank, from 2010 to 2050, nearly 120,000 people in the Asia-Pacific region will move to the city every day42. By then, the urban residents will account for 42% - 63% of the total population of this region. However, nearly two-thirds of the worlds’ poor live in this region. The "urban bias" model of development driven by the globalization and lack of adequate development opportunities in rural areas have brought about new problems and challenges caused by migration of population, such as inequality, lack of health and sanitation facilities, lack of access to safe drinking water and a large number of "slums" as well as the diseases and high mortality rate caused by poor living conditions.
4. 1 URBAN POVERTY
The urban poverty phenomena of slow economic growth in developing countries, limited jobs for labor mobilizing to citiesfrom rural area and the urban poor’s staying in slums with poor environment and living conditions due to the lack of opportunities for them to make a living and receive education and the lack of an appropriate social security mechanism are the realities Southeast Asian countries have to face in the urbanization process. In Cebu, the second largest city in the Philippines, 34.2% of the families live below the poverty line. Indonesia also has a large number of people long living in poverty. As for the daily household expenditure structure, in Medan, food expenditure accounts for 55.1% of the daily expenses.
4. 2 INADEQUATE URBAN PUBLIC SERVICES AND INFRASTRUCTURE
The flow of a large population towards the city brought a great challenge for the cities’ carrying capacity. Urban water supply systems, sanitation, electricity and sewage systems cannot meet the needs of the population, and the urban poor faces a more severe situation for obtaining access to these facilities and public services. In Vietnam, according to statistics, 300,000 cubic meters of industrial wastewater flows into the canal of Ho Chi Minh City every day. In Medan, only 19% of the households discharge sewage through the sewage pipes and this proportion in Manila of the Philippines is even lower, only 11%43. Due to the limited financial resources of the government, however, these countries provide much less support for the urban poor compared to developed countries. In addition, inadequate public services, such as education and health care, or poverty caused by diseases, will lead to intergenerational poverty, which is reducing the effects of the pro-poor policies of the Southeast Asian countries at the stage of rapid development of urbanization. It is ahuge challenge for the Southeast Asian countries in the process of rapid urbanization.
4. 3 HOUSING PROBLEM
A large number of urban immigrants cannot afford housing and slums have become their main residences. As of 2001, according to the UN statistics, the number of people living in slums in Asian countries (excluding China) was the largest in the world. Due to uncontrolled development, 35% of the urban population of Manila in the Philippines live in slums. In fact, the above-mentioned lack of urban infrastructure such as safe drinking water and sewerage systems have become the main source of waterborne diseases in urban slums, threatening the health of the urban poor (especially children under 5 years of age), resulting in a relatively high mortality rate in Southeast Asian countries. Lack of processing capacity also brought about the problem of recycling and disposal of a lot of rubbish in urban slums or shanty towns. Open dumps or incineration, meanwhile, which are often seen in these areas, , will also pollute the air and groundwater resources.
In addition, the Southeast Asian countries should also pay high attention to the employment problem in the process of urbanization, the poverty problem of landless farmers due to loss of land, the wealth gap between urban and rural areas and the wealth gap between urban residents in the urbanization process.
Thus, when the deadline of the Millennium Development Goals agenda stipulated by the United Nations is approaching, under a more inclusive "post-2015" development framework, the Southeast Asian countries should pay more attention to equity, balance their efforts on meeting the rapidly growing needs of the urban population and increasing support for the rural poor, include urban and rural residents into a unified system, further boost the rapid regional economic growth through urbanization, develop rational urban development strategies and provide relatively equal development opportunities so that all the participants of economic activities can equally enjoy the fruits of economic development, ultimately achieving inclusive development.
5. LESSONS TO BE LEARNED FROM SOUTHEAST ASIAN COUNTRIES
5. 1 COORDINATING URBANIZATION AND URBAN-RURAL
INTEGRATION
Since the 1970s, China’s urbanization level has been rapidly rising with ratio of urban population increasing to 51.3% in 2011 from 18% in 197844. Despite the fact that China is experiencing a period of rapid urbanization, due to historical, political and economic reasons, rural areas and urban areas are separate in terms of household registration (hukou), social security, health care and education systems.
From Southeast Asia’s experience, emphasizing urban expansion over rural development is shortsighted. Instead, the government should improve the economic and living conditions of the rural areas and increase living standards and incomes of farmers so as to realize balanced urban-rural development. In the process of urbanization, the government should also modernize agriculture, increase agricultural productivity, facilitate infrastructure building in the rural areas and realize integrated development of urban and rural areas.
The government should also pay attention to the migrant population and rural workers and respect their rights and interests so that they will not become disadvantaged and vulnerable groups in the city. That requires policy considerations on rural migrant workers in urban planning, household registration, public service access (especially housing, employment, children’s education and health care) and economic and livelihood security so that they can integrate into cities and enjoy the same public services as their urban counterparts.
5. 2 PURSUING A DIVERSIFIED PATTERN OF URBANIZATION
One of the lessons learned is to avoid urban population explosion and over-concentration of population in megacities. Over-concentration of the migrant population will give rise to over-concentration of slum dwellers, an issue of concern for many Southeast Asian countries in the process of urbanization. The Chinese government should, therefore, step up the development of small towns. It is meaningless to pursue a higher urbanization rate and it is neither realistic nor scientific for every city to become a megacity.
China should pursue a diversified pattern of urbanization. On the one hand, the government should endeavor to build core metropolises with international competitiveness and pillar industries and develop metropolis-based urban agglomerations. There are three urban agglomerations in China, namely the Pearl River Delta, Yangtze River Delta and Bohai Rim45. On the other hand, the government should actively develop small towns, because small towns act as an important bond between cities and villages due to their geographic proximity. However, the development of small towns is a weak link in China’s urbanization process. A wise way to develop small towns is to build local specialty industries in line with local characteristics. This two-pronged approach can maintain diversity of urban development in the process of urbanization.
5. 3 CREATING NEW EMPLOYMENT OPPORTUNITIES
Southeast Asian policies for promoting employment are very relevant to China. The government should provide skills training to the unemployed and rural migrant workers. In particular, the government should provide the migrant population, especially rural migrant workers, with targeted job information, develop IT systems and service capacity of employment service agencies and analyze local employment status and economic growth.
Exporting labor and gaining foreign exchange are practices worth learning from as they can ease the burden of unemployment and play a supplementary role in spurring economic growth. The government can identify appropriate countries for labor export and establish partnerships with the labor-importing countries and with domestic multinationals in order to ensure the safety and security of Chinese workers overseas.
5. 4 INVOLVING DIFFERENT STAKEHOLDERS INTO THE DEVELOPMENT
OF THE URBANIZATION PROCESS
STEP-UP shows that government efforts alone are far from enough. Stakeholders such as businesses, communities and NGOs should also be engaged in urbanization. China’s society is inadequately involved in urbanization. The core of integrating government planning and social involvement is that urbanization can faithfully reflect people’s needs, interests and issues of concern.
References
ADB. City Development Strategies to Reduce Poverty. Manila. June 2004.
ADB. Inclusive Cities (Brochure). Manila. 2011.
Laker, Judy. ‘Urban Poverty: A Global View’. World Bank Urban Papers, No.UP-5. Washington, D.C.
2008.
Li, Bihua. Unemployment in Southeast Asia and Solutions. Around Southeast Asia. [In Chinese].
45 Yi, Peng. ‘City Clusters Necessitate Final Confirmation of the Market’. Dahe Daily. [In Chinese]. Republished
QSTheory website. 6 June 2013. Available at http://www.qstheory.cn/zl/bkjx/201306/t20130606_237868.htm.
- 25 -
No.2. 1998. P.28-31.
Mathur, Om. Urban Poverty in Asia. Manila: ADB. June 2013.
Meng, Lingguo and Xu, Linqing. On How Southeast Asian Countries Solve Their Unemployment
Problems and on How China Can Benefit from Their Methods. Around Southeast Asia. [In Chinese].
No.1. 2004. P.24-29.
Ministry of Commerce of the People’s Republic of China. Unemployment Rate of the Philippines
Dropped Down to 6.4% in October. [In Chinese]. 16 December 2009.
Naudin, Thierry. (ed.) The State of Asian Cities 2010/11. United Nations Human Settlements
Program. 2010.
Niu, Wenyuan. (ed.) China’s New-Urbanization Report 2012. [In Chinese]. Science Press. Oct 2012.
Office of the National Economic and Social Development Board. Gross Regional and Provincial
Product Chain Volume Measures 1995-2010 edition. 2012.
Office of the National Economic and Social Development Board. THAILAND MILLENNIUM
DEVELOPMENT GOALS REPORT 2009.July 2010. Available at:
http://www.undp.or.th/resources/documents/Thailand_MDGReport_2009.pdf.
Sen, Amartya. Development as Freedom. Oxford: Oxford University Press. 1999.
Steinberg, Florian and Lindfield, Michael. (eds.). Inclusive Cities. Mandaluyong City, Philippines: Asian
Development Bank. 2011.
Steinberg, Florian. ‘Philippines: Strategic Private Sector Partnerships for Urban Poverty Reduction in
Metro Manila’, in Steinberg, Florian and Lindfield, Michael.(eds.). Inclusive Cities. ADB. 2011.
UN Department of Economic and Social Affairs. World Urbanization Prospects 2011. 2012.
UN-HABITAT. Cities in a Globalizing World: Global Report on Human Settlements. Nairobi, Kenya:
UN Center for Human Settlements. 2001.
UN-HABITAT. Global Urban Indicators. 2007b.
UN-HABITAT. Global Urban Indicators-Selected Statistics. November 2009.
UN-HABITAT. State of the World’s Cities 2010-11: Bridging the Urban Divide. 2010.
UN-HABITAT. World Urbanization Prospects: The 2007 Revision. 2007a.
World Bank. ‘Indonesia: A Nationwide Community Program (PNPM) Peduli: Caring for the Invisible’.
Available at
http://www.worldbank.org/en/results/2013/04/04/indonesia-a-nationwide-community-program
-pnpm-peduli-caring-for-the-invisible.
World Bank. Indonesia: Evaluation of the Urban CDD program – Program National Pemberdayaan
Masyarakat (PNPM-Urban).Policy Note. 2012.
World Bank. Povcal Net. Available at: http://go.worldbank.org/WE8P1I8250.
World Bank. Urban Poverty in East Asia. 2001a.
World Bank. Urban Poverty in the East Asian Region, Volume 2: Annex Tables. 2002.
World Bank. World Bank Human Development Indicators 2001.2001b.
World Bank. World Development Indicators 2013.2013.
Wu, Chongbo. Status Quo, Solutions and Prospects of Employment in Southeast Asia. Southeast
Asian Affairs. [In Chinese]. No.1. 2000. p.8-12.
Xin, Yuyan. Urbanization in Foreign Countries: Comparative Study and Inspirations from Their
Experience. [In Chinese]. Chinese Academy of Governance Press. January 2013.
Yi, Peng. ‘City Clusters Necessitate Final Confirmation of the Market’. Dahe Daily. [In Chinese].
Republished on http://www.qstheory.cn/. 6 June 2013.
- 26 -
CHAPTER 2 INDONESIA'S POVERTY REDUCTION PRACTICE
Zhang Jianlun Qiu Liyu Wang Xiaolin Feng Hexia
1. POVERTY AND INEQUITY IN INDONESIA
1. 1 OVERVIEW OF INDONESIA'S ECONOMIC DEVELOPMENT AND
POVERTY
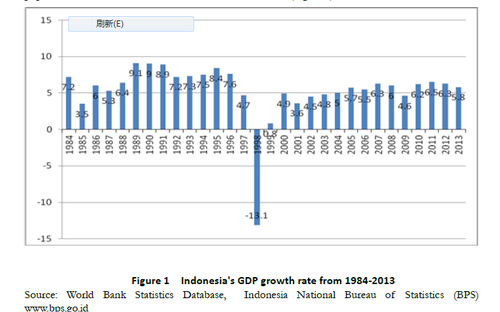
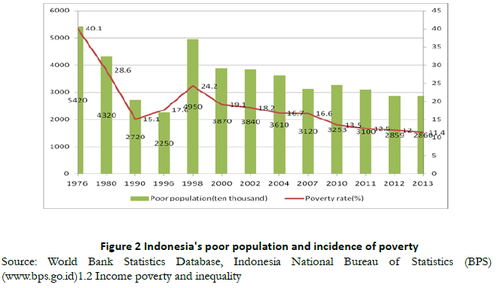
During Suharto's reign (1966-1998), Indonesia witnessed rapid economic development. Its average annual GDP growth rate reached 8% from 1980 to 1997 and even came to 9.1% in 1989 (Figure 1). Three decades of economic development had a great poverty reduction impact. According to Indonesia'-s National Bureau of Statistics, from 1976 to 1996, Indonesia's population rose from 135 million to 200 million, while its poverty rate dropped from 40.1% to 17.5% and its poor population decreased from 5.4 million to 2.25 million or so (Figure 2).
The Asian Financial Crisis, however, severely hurt the Indonesian economy. In 1998, Indonesia's economic growth rate dropped to -13.1%, which was a fatal blow to the poverty problem in the country, and its poverty rate sharply rose to 24.2% (Figure 2). After the financial crisis, by taking a series of measures, Indonesia gradually restored its economic and social development. From 2004-2013, its GDP growth rate remained at between 5% and 7%. In 2013, its per capita GDP amounted to $ 3,475, three times the figure before the crisis. With its economic recovery, Indonesia's poverty rate decreased. Its national poverty rate dropped from 24.2% in 1998 to 11.4% in 2013. As of March 2014, Indonesia had a poor population of 28.28 million, accounting for 11.25% of the total, smaller than the figure in September 2013 (28.6 million).
1. 2 INCOME POVERTY AND INEQUALITY
1. 2.1 INCOME POVERTY
According to the Indonesian government, those whose monthly income is less than 211,726 rupees (approximately $ 22) are poverty-stricken people. The World Bank, however, determined the international poverty line of $1.25 per day. The Indonesian government set different poverty lines for rural and urban areas, and the urban poverty line is much higher than the poverty line for rural residents. From 2007 to 2010, the urban poverty line was 41,773 rubles higher than the rural poverty line on average. In recent years, in addition, the Indonesian poverty standards are constantly changing. The national poverty line rose from 166,697 rubles in 2007 to 211,726 rubles in 2010, up 27.01%, exceeding the growth rate of GDP in the same period. The rural and urban poverty line respectively rose from 146,837 and 187,942 rubles to 192,354 and 232,988 rubles, up 31.00% and 23.97%, as shown in Table 1.
As the most populous country in Southeast Asia, Indonesia has a population of 240 million, accounting for about half of the total population of ASEAN countries. In recent years, with the economic recovery and the government's increased poverty reduction efforts, Indonesia's poor population maintains a declining trend and poverty rate drops at an annual rate of 1% or so. According to the latest data of the Indonesian Central Bureau of Statistics, as of 2013, the number of poverty-stricken people in Indonesia declined to 28.6 million, accounting for 11.4% of the total population. In 1998, however, this figure was 49.5 million, accounting for 24.2% of the total population. Indonesian government's latest target of poverty reduction is to reduce the poverty rate to 8% by 2014.
In addition, with the enhancement of the poverty standard, affected by the international and domestic economic fluctuations, the number of poor people in Indonesia and the incidence of poverty are constantly changing, but the change is a regular event. We can see from Figure 2 that, first of all, the incidence of poverty in Indonesia changed in different stages. Seen from the change in the number of poverty-stricken people and the poverty rate, there are three stages, i.e. 1976 - 1996, 1998 - 2007 and 2008 – now. Secondly, seen from the overall trend, the Indonesian population and poverty incidence both show a downward trend. The poor population, for example, decreased from 54.2 million in 1976 to 22.5 million in 1996, then dropped from 49.5 million in 1998 to 31.02 million in 2007, and finally declined from 32.53 million in 2010 to 28.6 million in 2013. Thirdly, economic crisis has a great impact on the incidence of poverty. As we can see from the above, the financial crisis in Southeast Asia in 1997 and the global financial crisis in 2008 both had a great impact on the Indonesian economy, resulting in a rapid growth of the poor population.
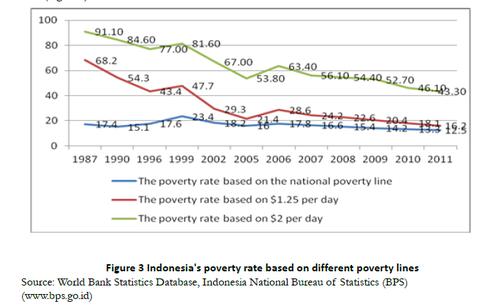
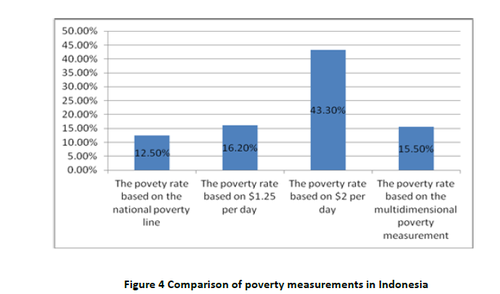
According to the poverty line of $ 1.25 a day determined by the World Bank, Indonesia has a poor population of 40.17 million, accounting for 16.2% of the total. Based on the poverty line of $2 a day, however, it has a total of 107.384 million poverty-stricken people, accounting for 43.3% of the total (Figure 3).
Figure 3 shows that although the poverty rates based on different poverty standards are obviously different, the three poverty standards all reflect the downtrend of Indonesia's poverty rate. The incidence of poverty in Indonesia declined from 17.4% in 1987 to 12.5% in 2011 based on Indonesia's national poverty line, and dropped from 68.2% to 16.2% in the same period according to the poverty standard of $1.25 a day. Based on the poverty line of $2 per day, however, the incidence of poverty in Indonesia was much higher, dropping from 91.1% in 1987 to 43.3% in 2011. On the one hand, it shows that in the past three decades, the incidence of poverty in Indonesia keeps declining and, on the other hand, it indicates that low-income people account for a high proportion of Indonesia's population. After the poverty line was raised from $1.25 a day to $2 per day, with an increase of $0.75, the incidence of poverty in Indonesia rose by 27.1% in 2011.
1. 2.2 INEQUITY
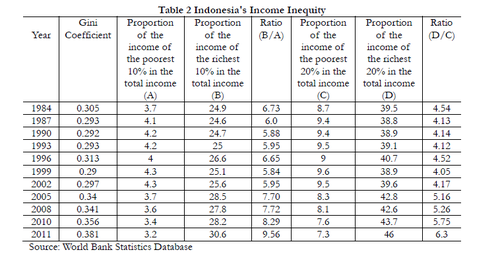
Indonesia's rapid economic development has achieved great poverty reduction effects, but expanded the income gap at the same time, resulting in an increasingly prominent problem of wealth disparity. Table 2 shows that Indonesia's Gini coefficient fell from 0.305 in 1984 to 0.293 in 1993.
From 1999 to 2011, however, the Gini coefficient showed a rising trend. As of 2011, the Gini coefficient rose to 0.381, close to the income distribution gap "cordon" 0.4.
In addition, from 1999 to 2011, the proportion of the total income of the richest 10% and 20% in Indonesia gradually rose, while that of the poorest 10% and 20% gradually dropped. The total income ratio between the richest 10% and the poorest 10% in Indonesia rose from 5.84 in 1999 to 9. 56 in 2011, and reached a peak of 10 in 2009. Moreover, the income ratio between the richest 20% and the poorest 20% increased from 4.05% in 1999 to 6.3 in 2011.
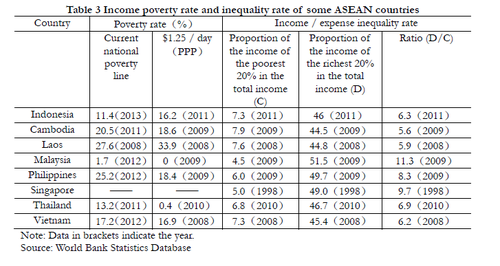
It is worth noting that although the income gap is widening in Indonesia, compared with some ASEAN countries, the income distribution in Indonesia is relatively fair (see Table 3). As a comparison between regions, Table 3 provides the poverty rates based on the current national poverty line and the poverty standard of $ 1.25 / day and the degree of equality of income / expenditure of some ASEAN countries (data available). No matter based on the national poverty line or the poverty standard of $ 2 a day, the incidence of poverty in Indonesia is relatively low and Indonesia's income and expenditure inequality rate is relatively low. Admittedly, Indonesia's sustained economic growth after the Asian Financial Crisis in 1998 provided more employment opportunities and poverty reduction projects, achieveing great poverty reduction effects and relatively fair employment opportunities.
1. 3 MULTIDIMENSIONAL POVERTY AND INEQUALITY DEGREE
1. 3.1 MULTIDIMENSIONAL POVERTY INDEX (MPI)
H (incidence of multidimensional poverty) multiplied by A (average degree of deprivation) makes the Multidimensional Poverty Index (MPI). The incidence of multidimensional poverty refers to the proportion of the people living in multidimensional poverty, while the average degree of deprivation indicates how the poor are averagely deprived, which is measured by various indexes. If 30% of the weight indexes of a person are deprived, then this person is considered to live in multidimensional poverty. Table 4 shows that in 2012, Indonesia's multidimensional poverty index was 0.066 and multidimensional poverty incidence was 15.5%, but its incidence of poverty was 12% based on the national poverty line. In addition, the multidimensional poverty in Indonesia occurs mainly in rural areas. The rural multidimensional poverty index is 0.093, but this figure in urban area is only 0.093. Meanwhile, the rural multidimensional poverty incidence is 2 times that of the city and the average degree of deprivation in rural areas is 6.3% higher than that in the city.
1. 3.2 COMPARISON BETWEEN MPI AND OTHER POVERTY
MEASUREMENT INDEXES
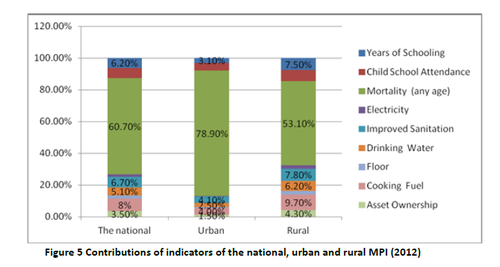
Figure 4 is a comparison between MPI and other three commonly used income poverty measurement indexes. The first column refers to the incidence of poverty in Indonesia based on the national poverty line, the second and the third respectively refer to the incidence of poverty based on the poverty line of $1.25 a day and $2 a day, and the last one refers to the proportion of the people living in multidimensional poverty, i.e. the incidence of multidimensional poverty (H). Among them, the former three poverty rates are statistic data of the World Bank Statistics Database in 2011, while the incidence of multidimensional poverty was the statistic data of the database of Oxford Poverty and Human Development Initiative in 2012. Figure 4 shows that the incidence of multidimensional poverty in Indonesia is higher than the poverty rate based on the national poverty line, close to the incidence of poverty in accordance with the poverty standard of $1.25 a day. Figure 5 shows that a relatively high mortality rate, no access to clean fuels and the lack of health facilities are all important factors leading to multidimensional poverty. Multidimensional poverty provides information on poverty beyond income poverty.
1. 3.3 DEGREE OF DEPRIVATION MEASURED BY EACH INDICATOR OF
MPI
Multidimensional Poverty Index are measured by 10 indicators on education, health and living standards, including two educational indictors, namely the years of education and children's school enrollment rate, two health indicators, namely nutrition and child mortality, and six living standard indicators, covering the use of electricity, sanitation, drinking water, flooring, cooking fuel and asset. Due to the lack of the nutrition indicator data, the multidimensional poverty index in Indonesia is measured by nine indicators. Figure 5 shows the contributions made by the urban and rural MPI in Indonesia in 2012 and each box represents an indicator's degree of contribution to the national MPI. The larger it is, the higher its weight in the MPI. We can see from Figure 5 that in urban multidimensional poverty, the mortality (including any person) made the greatest contribution and its contribution rate was as high as 78.9%, followed by the children's school enrollment rate (5%) and health facilities (4.1%); In rural multidimensional poverty, the mortality (including any person) also made the greatest contribution and its contribution rate was as high as 53.1%, followed by cooking fuel (9.7%) and health facilities (7.8%). The policy implication of this result is very obvious: In 2012, Indonesia's urban and rural pro-poor policy should first address the health problem and reduce the mortality rates of all groups, then strive to enhance the children's school enrollment rate in the city and improve the urban health facilities. In addition, it should focus on improving the cleanliness of cooking fuels and health facilities in rural area, increase the years of education and enhance children's school enrollment rate in rural area.
2. OVERVIEW OF THE INDONESIAN GOVERNMENT'S POVERTY
REDUCTION STRATEGY AND POLIC
Over the years, poverty alleviation has been the primary task of the development of Indonesia, arousing high attention of the Indonesian government. Poverty alleviation and the improvement of people's welfare are two statutory obligations provided by the Indonesian Constitution of 1945; poverty reduction is one of the primary tasks and key policies of the National Medium-term Development Plan (RPJM) 2004-2009. The Indonesia National Medium-term Development Plan 2010-2014 and National Long-term Development Plan 2005-2025 both take poverty reduction as an important task.
2. 1 POVERTY ALLEVIATION GOVERNMENT DEPARTMENTS
Indonesia's central departments responsible for promoting poverty reduction work include the Coordinating Ministry of People's Welfare and Inter-ministerial Poverty Reduction Committee. The former, established in the 20th Century, is one of the three coordinating bodies of the Indonesia's central government, while the latter, founded in 2011, is responsible for coordinating relevant national departments to prepare the mid-term poverty reduction strategic documents (I-PRSP) as the outline of the national poverty reduction strategy (SNPK) through organizing a series of meetings and other exchange activities. As for local poverty alleviation government departments, the autonomous system is still at the stage of improvement and special poverty reduction agencies are not mature yet, but local governments have begun to attach importance to poverty reduction and made relevant efforts.
2. 2 POVERTY REDUCTION STRATEGY
Indonesia's poverty reduction policies are composed of three horizontal dimensions and two longitudinal dimensions. The three horizontal dimensions include plan, finance and project – incorporating poverty reduction issue into the macro development plan to be guaranteed by the finance and finally implementing the specific poverty reduction projects. The two longitudinal dimensions refer to central and local government level. In addition, two ongoing major reforms have effectively promoted the implementation of the whole poverty reduction policy system: the local self-government and subsidy reform.
2. 2.1 NATIONAL POVERTY REDUCTION PROGRAMS
Indonesia's national strategic poverty reduction plans mainly include the National Poverty Reduction Program (SNPK), the National Medium-term Development Plan (RPJM) 2004-2009, the National Medium-term Development Plan 2010-2014 and the National Long-term Development Plan 2005-2025.
In 2002, Indonesia prepared an interim poverty reduction strategy paper, which made arrangements for the preparation of the national poverty reduction program (SNPK) by the relevant ministries, commissions, local governments, NGOs and academic circles. As the participation of relevant parties could not be guaranteed, however, the SNPK finally changed from an independently prepared programmatic document to an important issue in the national mid-term development plan / annual plan. The Medium-term Plan 2004-2009 clearly put forward to reduce the poverty rate to 8% by the end of 2009 and incorporated the comprehensive alleviation of multidimensional poverty into three important agenda, namely "Prosperous Indonesia," "Democratic Indonesia" and "Peaceful Indonesia"46. The Medium-term Planning developed from an programmatic document for the mid-term development into an annual development plan of the central and local governments and was implemented successfully.
Currently, Indonesia is implementing the National Medium-term Development Plan 2010-2014. Like the Medium-term Development Plan 2004-2009, this plan has three economic development strategies: "to promote growth, promote employment and eradicate poverty". At present, the Indonesian government's poverty reduction measures include five strategies, namely to strengthen the purchasing power, to ensure people's access to basic services, to ensure smooth channels for people to take part in market activities, to control population and to improve productivity. In order to enhance the effectiveness of these strategies, poverty reduction projects are divided into four categories: First, social protection and assistance projects, such as the provision of rice for the poor and scholarships for poor students; Second, projects to support the development of local communities. Third, projects to help small or micro-enterprises; Fourth, projects to assist fishermen and the marginalized groups in the city or underdeveloped regions. Meanwhile, President Susilo Bambang Yudhoyono has issued a decree on fair and inclusive economic growth to guide officials and other relevant persons to fully promote the realization of the Millennium Development Goals.
2. 2.2 NATIONAL POVERTY REDUCTION BUDGET
As for fiscal budget, Indonesia mainly launched the budgetary reform to provide financial security for effective poverty reduction plans. Through the State Finance Act and the National Development Planning Act, it changed former non-standard budget system to better support poverty reduction; ensured capital expenditures serves sustainable development; determined a rational medium-term development finance structure; connected with the international economic accounting system; optimized the former development expenditures; combined the budget expenses of various ministries and commissions; and formulated the budget program based on the work plan and expenditure effects.
2. 2.3 LOCAL PRO-POOR POLICIES NEED TO BE IMPROVED
The launch of the local self - government system in Indonesia gave greater autonomy to local governments, bringing new opportunities and challenges for the development of the cause of local poverty reduction. Local self-government strongly stimulated grassroots departments’ aspirations for development, bringing new opportunities for local poverty reduction. Although the local government has not established a complete, mature planning and budget system to ensure concern for pro-poor 46 "Prosperous Indonesia": To reduce poverty, increase employment opportunities, enhance the level of health and education while promoting pro-poor economic growth, and protect the resources and environment. "Democratic Indonesia": To strengthen the legal system building to improve the fairness and justice, take the eradication of corruption and promoting local autonomy as an important issue, and strengthen people's participation in political and economic development. "Peaceful Indonesia": To reduce regional separatism, promote regional stability and build a harmonious environment for effective reduction of urban and rural crime rates. growth, the government is making efforts to make the economic growth more conducive to poverty reduction.
2. 3 PRO-POOR POLICY
Before the Financial Crisis in Southeast Asia, Indonesia's main poverty alleviation projects included rural infrastructure development projects (RAIDP) and urban and rural poverty reduction projects (PARUL). After the financial crisis, in order to stabilize the economy, the government adjusted the above two projects and implemented new poverty reduction projects, including the Community Rehabilitation Program (CRP), the Urban Development Plan (UPP), etc. Currently, the Indonesian government implements the "three-pronged" economic development strategy, i.e. to "promote growth, promote employment and eradicate poverty". It has launched a variety of projects to directly or indirectly eradicate poverty. Among the poverty alleviation projects, the most common one is the PNPM project launched in 2007, which is the largest poverty alleviation project of the Indonesian government so far with the purpose to directly lift people out of poverty from the community and village level. Among the national self-reliance community projects, each place has a regional management office and the working staffs are directly elected by the villagers. To avoid deduction in intermediate links, the central government allocated the funds directly to this office every year. The local governments can only control 5% -20% of the funds, and the remaining is by this office. Local villages all declare projects they need to the regional management office every year. The office holds village meetings to discuss the project feasibility and determine the priority projects, and then allocates funds to the villages. Through issuing small loans and providing cheap electricity and water, this project really helped the poor improve quality of life and production level. In addition, the self-sustaining community project implements the "fishing rod" mode. For example, it provides 3 billion rupiah of financial subsidy for each community every year, and allows the people of the communities or villages to decide how to use the subsidy. As of 2013, 6623 counties and districts in Indonesia had successfully launched this project.
Other poverty alleviation projects include the unconditional subsidized cash transfer program (BLT) for the poor, conditional cash transfers (CCT) for extremely poor families, living subsidy projects (eg, rice, fertilizer, project credit and other subsidies), public health Insurance (Jamkesmas), learning management support project (BOS) and the Family Hope Project (PKH) covering all poor families or the families close to the poverty line. Among them, the CCT program for extremely poor families targets at kids, pregnant women and children from poor families, aiming to increase channels for the children of impoverished families and pregnant women to get health services, improve the nutritional status of children from extremely poor families and enhance the school enrollment rate of these children. Practices have proved that the program has succeeded in reducing infant mortality. The Family Hope Project (PKH) is designed to help the poor meet the basic living needs when needed.
In addition, the Indonesian government is now gradually reducing fuel subsidies and other subsidies conducive to the non-poor and invests the saved capital ($ 2 billion in 2005 and $ 3 billion in 2006) in the construction of relevant projects in four poverty reduction fields: (1) Social protection – providing cash subsidies to poor families affected by fuel price fluctuations; (2) Education - cutting education fees to more effectively guarantee the right to education of people (especially the poor); (3) Health - providing free basic medical care and service for the poor; (4) Rural infrastructure construction – providing construction funds for 13,000 impoverished villages. The principles of Indonesia's pro-poor policy can be summarized as "one center and three basic points". One center: To "ensure sustainable pro-poor policy formulation, project implementation and resource allocation." Three basic points: "High attention", "results-oriented" and "broad participation".
2. 3.1 HIGH ATTENTION
The National Development Strategy, Plan and Poverty Reduction Program all attach great importance to poverty reduction, mainly manifested by:
(1) The government takes poverty reduction as the primary task in its work plan and pushes forward the project implementation. From 2006 to 2007, for example, the Program Outline clearly required to give priority to anti-poverty projects in the allocation of fiscal funds, used the funds in improving the health, drinking water and infrastructure conditions of the poor, increased opportunities for employment and entrepreneurship and improved the social protection system (natural disaster prevention and the protection of vulnerable groups).
(2) Improving the targeting of pro-poor policies. Give priority to the issues of greatest concern to the poor in problem addressing and implements the most effective pro-poor policy, including to invest in health, education, nutrition and infrastructure, to reduce energy subsidies that do not benefit the poor and to spend the saved money in pro-poor projects.
(3) Accelerating the capacity building of local government institutions. Fiscal budgets of local governments are linked with the pro-poor policies, which effectively accelerating the poverty reduction process.
(4) Putting emphasis on community self-reliance programs. To understand the needs of the poor and people at grassroots through the participation of the general population so as to boost development.
2. 3.2 RESULTS-ORIENTED
In recent years, the Indonesian government has strengthened the result orientation in the formulation of development plans. In the government's annual work plan, for example, it provides specific poverty reduction targets and strengthened the empirical analysis of project to ensure scientific and effective project design and resource targeting. First, support the development of statistical system, especially the data acquisition and analysis in the field of grassroots multidimensional poverty reduction. Second, require the relevant ministries and commissions to carry out regular evaluation of the relevant projects. Third, strengthen the grassroots government's pro-poor development programs and the result orientation of budgeting: Incorporating the quantified objectives into the development plans; carrying out regular quantified monitoring on the projects.
2. 3.3 BROAD PARTICIPATION
Promote public formulation of the National Poverty Reduction Program (SNPK) and encourage the participation of grassroots government, NGOs and academic circles. Promote the development of community self-reliance programs, enhance the grassroots participation in decision-making, and effectively guarantee the priority of pro-poor growth issue through the involvement of poverty-stricken people in decision-making.
3. INDONESIA'S EXPERIENCE IN POVERTY REDUCTION & THE
CHALLENGES
3. 1 REMARKABLE ACHIEVEMENTS IN POVERTY REDUCTION IN
SUHARTO'S NEW ORDER ERA FROM 1965 TO 1998
From 1969 to 1994, Indonesia's GDP per capita increased from $ 70 to $ 700 and most of the poor people shook off poverty. Its poor population decreased from 54.2 million in 1976 to 22.5 million in 1996 and the incidence of poverty declined from 40.1% to 17.6%. This is the stage with the most pro-poor growth in the history of Indonesia (Ministry of National Development Planning, 2006). The main reasons are as follows:
3. 1.1 RAPID ECONOMIC GROWTH
Indonesia's economic growth is mainly reflected by the reduction in farming population, the growth of industrial labor force and the labor flow from rural area to the city. On the one hand, with the development of agricultural productivity, there appears some surplus labors in rural area who are transferring towards non-agricultural industries and, on the other hand, with the enhancement of the production capacity and wage levels, the manufacturing industry accepted these surplus labors. In the two decades after the New Order era, about half of the poor shook off poverty through transferring to non-agricultural industries and primary urbanization.
3. 1.2 UNIVERSAL PRIMARY EDUCATION
In the new era with sustained economic growth, the maximum benefit for the people of Indonesia is the increased educational opportunities for the poor. The Suharto government vigorously developed education and the universal primary education had the most profound impact on poverty reduction: Indonesia launched large-scale construction of schools from 1974 to 1978, deliberately integrating resources on primary education. In 1987, Indonesia's primary school enrollment rate was 92% (91% in rural areas, only one percentage point below the national average). The rapid development of primary and secondary education in Indonesia provided a chance for the poor to enjoy the most basic education, significantly reduced poverty due to lack of basic education and training and played a key role in cutting the intergenerational transmission of poverty.
3. 1.3 THE DEGREE OF INEQUALITY ENHANCED BUT IS LOWER THAN
THAT IN OTHER COUNTRIES OF THE SAME REGION IN THE SAME
PERIOD
With the rapid economic development, Indonesia's income gap is widening. Indonesia's Gini coefficient was 0.293 in 1993 and increased to 0.313 in 1996. The wealth gap between urban residents expands more rapidly than that among rural residents. From 1993 to 1996, the urban Gini coefficient changed from 0.33 to 0.362, while the rural Gini coefficient increased from 0.26 to 0.274. Nevertheless, after a horizontal contrast, we have found (Table 3) that in this period, the income distribution gap in Indonesia is much smaller than that in other Southeast Asian countries: In 2011, the total income ratio between the richest 20% and the poorest 20% of the population in Indonesia was 6.3, but this ratio in Singapore, Malaysia, Thailand and the Philippines was respectively 9.7, 11.3,
6. 9 and 8.3. Thus, the poor and ordinary people of Indonesia benefited much more from the development than those in other Southeast Asian countries.
3. 2 NEW CHALLENGES FOR POVERTY REDUCTION IN THE TRANSITION
PERIOD FROM 1998 TO 2014
At the end of last century, due to the Financial Crisis in Southeast Asia, Indonesia witnessed economic turmoil and the resulting government credit crisis and absence of public service funding, leading to rising prices (inflation rate reached 58% in 1998) and soaring unemployment (the

扫描下载手机客户端
地址:北京朝阳区太阳宫北街1号 邮编100028 电话:+86-10-84419655 传真:+86-10-84419658(电子地图)
版权所有©中国国际扶贫中心 未经许可不得复制 京ICP备2020039194号-2

