2014-The 8th ASEAN-China Forum on Social Development and Poverty Reduction2
unemployment rate in 2005 was up to 11%). As a result, the number of poverty-stricken people soared from 22.5 million in 1996 to 49.5 million in 1998 and the incidence of poverty also rose from 17.6% to 24.2%. Subsequently, the government carried out a reform of economic and social order and implemented a series of economic recovery policies and social safety net programs for the poor, gradually alleviating the poverty situation. As of March 2014, Indonesia had a poor population of 2828 million, accounting for 11.25% of the total. So far, Indonesia has made tremendous achievements in poverty reduction, but the cause of poverty reduction is still facing the following major challenges in the period of economic and social reform.
3.2.1 INDONESIA'S ECONOMIC INEFFICIENCY
Indonesia's great achievements in poverty reduction are largely dependent on the rapid economic development. The main driver of economic growth in Indonesia, however, is the increasing high investment rate and labor inputs, and the improvement of total factor contributed little to the economic growth. Indonesian expert Hall believes that in the mid-1960s, Indonesia's capital output ratio (ICOR) was about 1:4, and this ratio rose to 1:9 or so in the 1980s. After that, it declined to some extent, but still remained at about 1:4 in the early 1990s. The capital-output ratio in developed countries, however, is generally 1:1.5-2.5. Capital and labor inputs are limited after all and the growth elasticity is limited. Technological progress and management are the sources of sustained, steady economic growth. In addition, due to the trade protection, corruption and inefficiency of state-owned enterprises, etc., the cost of economic growth in Indonesia is fairly high and Indonesia's economy is known as the "high-cost economy" in the world. According to the "Global Competitiveness Report 2003-2004" announced by 2003 World Economic Forum, among the 101 countries involved, Indonesia ranked the 67th and 72nd for its growth competitiveness index and the 64th and 60th for its business competitiveness indicator respectively in 2002 and 2003, and the international competitiveness of its economy was relatively weak47. Low economic efficiency and weak international competitiveness is one of the major obstacles faced by Indonesia's anti-poverty work.
3.2.2 A LARGE POPULATION LIVING IN EXTREME POVERTY WITH
VULNERABILITY
Currently, Indonesia still has a large number of people living below or close to the poverty line and no changes have taken place to the living conditions of these people. As of 2011, in accordance with the Indonesian national poverty line, its poor population dropped to 31 million, accounting for 12.5% of the total. Based on the poverty line of $1.25 a day, however, its poverty-stricken population was 40.17 million, accounting for 16.2% of the total. In accordance with the poverty standard of $2 a day, Indonesia had a poor population of 107.384 million, accounting for 43.3% of the total. After the poverty line was raised from $1.25 a day to $2 per day, with an increase of $0.75, the incidence of poverty in Indonesia rose by 27.1% in 2011. It is thus clear that low-income people account for a high proportion of Indonesia's population. Facing the risks of sudden price rise, unemployment, illness, etc., these people apparently lack the ability to combat.
3.2.3 SIGNIFICANT DIFFERENCES BETWEEN URBAN AND RURAL
POVERTY
On the whole, the poverty situation in rural areas of Indonesia is much more serious than that in the city. Since 1996, the difference between Indonesia's urban and rural poverty rates has remained at 7-8 percentage points. In 2010, the rural poverty rate in Indonesia was 17%, while the urban poverty rate was only 10%. Poverty in urban and rural areas has different performances and characteristics. High unemployment and high inflation are the main problems faced urban poverty. After the financial crisis, many factories closed due to the decreased foreign investment, resulting in a large number of unemployed people and sharp inflation, thus leading to a sharp increase in urban poverty. According to official statistics of Indonesia, in 2002, Indonesia's urban unemployment rate was up to 12% (higher than the national average of 9.5%), but some Indonesian scholars48 believe that in 2005, half of the workforce in Indonesian were actually unemployed or underemployed. In addition, the multidimensional poverty index is 0.093 in rural areas and only 0.039 in the city, and the indicators' contribution rate to rural multidimensional poverty is much higher than that to urban multidimensional poverty. In particular, the child health, cooking fuel, countryside.
3.2.4 REGIONAL DEVELOPMENT IMBALANCES AGGRAVATED POVERTY
Like the imbalance in regional economic development, Indonesia's poverty situation also differs from region to region. As nearly 80% of the people live in the western island of Java and Sumatra, most of Indonesia's poor people appear in the west. The poverty rate in the east, however, is higher than that in the west. In 2007, for example, the incidence of poverty in Java was 4.6%, but the poverty rate in Papua reached 40.8% (the incidence of poverty in the rural areas of Papua New Guinea was even up to 50.5%).
Huge difference in the incidence of poverty in Indonesia's eastern and western areas is resulted from the wide difference of economic development. The western regions, where the capital was 47 Lai Liyun: "Indonesia's Economic Development Achievements and Drawbacks (1945-1998)", "Journal of Guangxi University (Philosophy and Social Sciences)" 2006, No. 11.
located in Suharto era, were allocated a lot of resources for political reasons. The revenues of the resources and economic development in the east, however, are mostly transferred to the central government through the centralized financial system. Meanwhile, the immigration policy implemented in Suharto era to balance the development between the east and west did not effectively protect the eastern labor force. As a result, the western immigrants took the employment opportunities of eastern residents, further deteriorating the living situation of local residents. In the transition period of reform after 1998, to balance the regional development gap, Indonesia changed the "centralization" and vigorously implemented the system reform to "decentralization to local governments". This reform, however, failed to effectively alleviate the poverty situation in the recent decade. On the one hand, during a certain period of time after the reform of decentralization, various local interest groups witnessed internal conflicts and local government corruption of power flared up, not concerned about people's livelihood and poverty problem, making it difficult to reduce poverty. Moreover, the problem of corruption arising from the rise of local interest groups further occupied the resources, which exacerbated the inequity to some extent, thereby exacerbating poverty. On the other hand, the uneven distribution of resources resulted in different financial situations of local governments, which may further expand the wealth gap between regions. After self-government, only 10 counties have fiscal surpluses and 237 counties make ends meet. The regional difference in fiscal status and regional difference in business tourism and other economic resources may result in greater differences in regional development.
In addition to the above problems, the current poverty reduction in Indonesia still faces many challenges: the country's high unemployment rate of 6.8%, slow development in remote areas, poor infrastructure and bureaucracy, etc. Meanwhile, global climate change, unstable international economic situation, fluctuations in international commodity and energy prices and continued turmoil in West Asia and North Africa are all challenges for Indonesia's poverty reduction. It is easy to see that poverty reduction in a developing countries with a large population is a long-term arduous task. But there is reason to believe that under the joint efforts of government and all circles of society, Indonesia will make more rapid progress in poverty reduction.
References:
Antara News Agency (ATR), Indonesian Foreign Minister, Annual Report 2009
Cao Yunhua, "Study of Indonesia's Poverty", "Southeast Asian Studies", 2005, No.6, Page 4-9.
Chen Yande, "Unfair distribution of resources Between the Indonesian Island of Java and Other
Islands: Interpretation From the Perspective of Ethnic Relationship", "Southeast Asian Studies", 2007,
No.1, Page 4-10.
Lai Liyun: "Indonesia's Economic Development Achievements and Drawbacks (1945-1998)",
"Journal of Guangxi University (Philosophy and Social Sciences)" 2006, No. 11, Page 171-173.
Wei Hong, "Indonesia's Economic Development and Conflict in Suharto Era", "Contemporary
Asia-Pacific Studies", 2002 No.10, Page 51-55.
Website of Ministry of Foreign Affairs, PRC. http://www.fmprc.gov.cn
Adam Schwarz, A Nation in Waiting: Indonesia in the 1990s[M] Westviews Press,1994
Adam Schwarz, Indonesia After Suharto[J] Council on Foreign Relations P119-134,1997
Ministry of National Development Planning, Republic of Indonesia, Poverty Reduction in Indonesia:
A Brief Review of Facts, Efforts, and Ways Forward, Forum on National Plans and PRSPs in East
Asia, 2006.
Maksum Choiril, Development of Poverty Statistics in Indonesia: Some Notes on BPS Contributions
in Poverty Alleviation, 2004.
World Bank, Combating Corruption in Indonesia, 2003.
CHAPTER 3 CAMBODIA'S POVERTY REDUCTION PRACTICE
Wang Erfeng Yang Yanran Xiao Pinghui
Since 2004, Cambodian garment industry, construction, agriculture and tourism have witnessed rapid growth. Since 2010, Cambodia's average annual GDP growth rate has remained at 7% or so, laying a good foundation for poverty reduction. In 2012, Cambodia's Human Development Index was 0.543, below the average of the East Asian region, and the prevalence of malnutrition was as high as 15.4%. According to the World Bank’s poverty standard of $ 1.25 per day, the incidence of poverty in Cambodia was 18.6% in 2009. The poverty reduction in Cambodia, therefore, is still facing challenges. This paper is aimed to analyze the poverty situation in Cambodia, the challenges for its poverty reduction, as well as the national pro-poor strategies and policies.
1. CAMBODIA'S ECONOMIC DEVELOPMENT
As a traditional agricultural country with a weak foundation for industrial development, Cambodia is one of the world's least developed countries with poverty-stricken people accounting for 28% of its population. With a free market economy characterized by opening up, the Cambodian government implements economic privatization and trade liberalization and takes economic development and poverty eradication as the primary task. Taking agriculture, processing, tourism, infrastructure construction and personnel training as the priority areas to support, it vigorously promotes the administration reform and strives to enhance the government efficiency and improve the investment environment. In 2013, Cambodia recorded a GDP of $15.25 billion and per capita
GDP of $1,008.
1.1 FROM A PLANNED ECONOMY TO A MARKET ECONOMY (1980 TO
1992)
After the mid-1980s, the Phnom Penh regime created the first Five-Year Plan (1986-1990) to restore and develop the economy and deal with social affairs. Giving priority to the restoration and development of grain, rubber, wood and aquatic production, it stressed the recovery and development of industrial production and put forward the plan targets. As a legitimate form of economy, private enterprises were recognized by the government and soon witnessed a rapid rise thanks to the preferential policies issued by the government. In 1989, further changes took place to the Phnom Penh regime's economic system, the former centrally planned economy was converted into a market economy, and many state-owned enterprises leased their equipment and materials to individuals. In July of the same year, the government promulgated the "Law on Foreign Investment in Cambodia" to attract foreign businesses to invest in Cambodia. In rural areas, the government abolished the agricultural cooperative organizations, implemented the contract system and divided the land for farming by peasants. In addition, it allowed farmers to engage in transportation, fishing, etc., and carried out a reform of the tax system. In urban areas, Phnom Penh and other cities began to restore private ownership, attracting many returned overseas Cambodian and foreign investors. Meanwhile, Cambodia’s trade with Thailand and Singapore witnessed rapid development. The second Five-Year Plan (1991-1995) emphasized the following priority areas: Agriculture, especially the development of rice production;
II. Electricity;
III. transportation;
IV. Development of cities, especially the development of Phnom Penh;
V. Public welfare, health, culture and education, etc. At the initial stage of economic development, especially in the post-war reconstruction phase, the planned economy and the government's intervention in the economy plan had an irreplaceable institutional advantage. The rich natural resources in Cambodia, however, were not effectively utilized after the war. In addition, due to lack of technical personnel, it was difficult for Cambodia to develop its economy and social undertakings at the initial stage of its planned economy. From 1980 to 1992, its GDP declined by 7.1% on average. In 1980, it recorded a GDP of $ 696.7 million and per capita GDP of $ 107.179; In 1992, however, its GDP was only $ 100.2 million and per capita GDP was as low as $ 50.596, and Cambodia became one of the world's least developed countries. From 1980 to 1992, Cambodia’s GDP fell by 84%, but the food production increased by 31% thanks to its great efforts on land reclamation, resulting in an increase of 94% in exports.
1.2 EARLY STAGE OF ECONOMIC REFORM (1993 - 1999)
In May 1993, the coalition government of Kingdom of Cambodia was established. At inception of the new government, King Sihanouk proposed the economic development policy with the improvement of people's livelihood as the core and adopted many political, military, diplomatic and economic measures for national peace, social stability and a better economic situation. In the financial field, the banking system in Cambodia underwent several reforms, and the National Bank of Cambodia (NBC) was established based on the original single bank. As of 1994, the government stripped out all the commercial functions of the National Bank of Cambodia, implemented managed floating exchange rate policy and, relying on strict financial policy, strived to ensure the stability of the foreign exchange market. The Cambodian government has been implementing a large-scale financial reform plan in public sector to create a favorable environment for Cambodia's macroeconomic stability and better integration into the regional and world economy. In trade industry, the Cambodian government amended a large number of rules on investment in accordance with the free new investment law. In 1999, Cambodia successfully joined the ASEAN Free Trade Area (AFTA), which was a crucial step in Cambodia's economic development and a springboard for Cambodia to further integrate into the world economy.
The International Monetary Fund (IMF) canceled the credit limit on Cambodia in October 1993. On May 6, 1994, IMF approved a three-year loan of $ 120 million to Cambodia to help the Cambodian government implement the economic adjustment and reform program (1994-1996). Since the establishment of the coalition government of the Kingdom of Cambodia in 1993, Cambodia's average annual GDP growth rate has reached 5.6%. As the most important industry in Cambodia, agriculture contributes 40% to the GDP, and more than 70% of the labors engage in agricultural production. The average annual growth rate of agriculture is 3.6%, but the agricultural production fluctuates in different years. As the main engine of economic development in Cambodia, the industry has an average growth rate of 16%. The contribution rate of services declined from 39% in 1993 to 31% in 2001. Cambodia's garment export value was $ 4 million In 1994, and this figure increased to $28 million in 1995 and reached $38 million in the first half of 1996.
1.3 ECONOMIC DEVELOPMENT IN THE NEW STAGE (2000-NOW)
In the new century, Cambodia continues to maintain a relatively strong economic growth momentum. From 2000 to 2010, the average GDP growth rate was 8.13% and average annual inflation rate (measured by the consumer price index) was 5.03%. On October 13, 2004, Cambodia joined the WTO and its economy maintained rapid growth. Affected by the global financial crisis, however, its GDP growth rate fell to 0.1% in 2009, but rebounded to 6% in 2010. Since the beginning of the new century, Cambodia has entered a stage of stable development. In April, 2014, the World Bank issued the " East Asia Pacific Economic Update, April 2014 - Preserving Stability and Promoting Growth " It reveals that the Cambodian economy has managed to despite strong domestic pressures maintain high economic growth. Though political uncertainty and labor unrest since the second half of 2013 created adverse effects, inflation has been reasonably controlled. Real economic growth is predicted to reach 7.4 percent in 2013, which is driven mainly by the garment and tourism sectors and that of 2014 is estimated to reach 7.2 percent.49
2. POVERTY SITUATION IN CAMBODIA
2.1 CONSUMPTION POVERTY
According to the poverty line of $ 1.25 a day set by the World Bank, from 2007 to 2009, the incidence of poverty in Cambodia was respectively 32.2%, 22.8% and 18.6%.
Cambodia's national poverty line is determined based on the food poverty line and non-food poverty line. The food poverty line is calculated according to the standard of 2,100 calories per person per day, while the non-food poverty line is about 10% of food poverty line.. National poverty rate is the percentage of the population living below the national poverty line. National estimates are based on population-weighted subgroup estimates from household surveys. World Bank reveals that national poverty rate in Cambodia from 2009 to 2011 is 23.9%,22.1% and 20.5% respectively. In addition, according to World Bank's data, the Gini coefficient in Cambodia was respectively 44.4, 37.9 and 36.0 from 2007 to 2009 and the unfair income distribution has been alleviated.
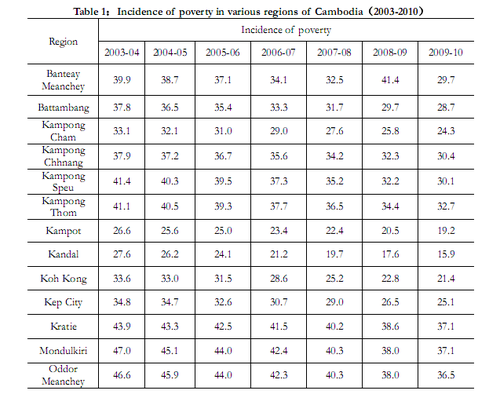
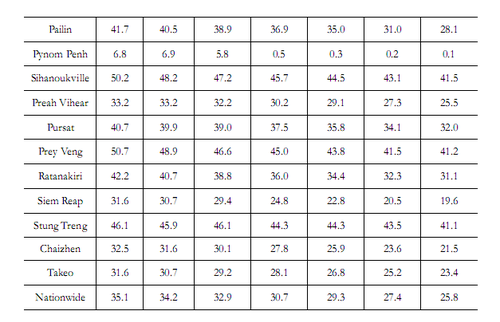
Table 1 shows the incidence of poverty throughout Cambodia. From 2003 to 2010, the
incidence of poverty in Cambodia declined from 35.1% to 25.8%.
2.2 EDUCATION AND HEALTH
The easy access to education (primary and secondary education) and health services (especially in rural areas) in Cambodia shows that the government's development strategy has achieved initial results. Educated population ratio increased from 77.8% in 2004 to 85.5% in 2011. Illiteracy rate among women fell from 28.7% in 2004 to 19.5% in 2011 and the gender inequality in basic education declined to some extent.
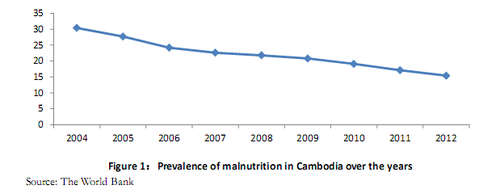
The infant and young children mortality rate dropped from 87‰ in 1996 to 43‰ in 2010, the infant mortality rate fell from 120 ‰ to 51 ‰ and the maternal mortality rate declined from 750 per 00,000 to 250 per 100,000 over the same period. The urban-rural gap in access to social services is still large and it is difficult for the rural areas with a low population density to receive social services. Women, children, the elderly, the disabled and the chronically ill are most vulnerable. Severe malnutrition in rural areas is prominent. In recent years, although the prevalence of malnutrition in Cambodia has declined to some extent, it is still fairly high. In 2012, for example, the prevalence of malnutrition in Cambodia was 15.4% (Figure 1).
2.3 MULTIDIMENSIONAL POVERTY INDEX (MPI)
According to the Global Multidimensional Poverty Index announced by the Oxford Poverty and Human Development Initiative (OPHI), in 2010, Cambodia's multidimensional poverty index was 0.212, multidimensional poverty incidence was 45.9% and the average intensity of deprivation was 46.91. Urban poverty contributed 18.1% to the multidimensional poverty and rural poverty contributed 81.9%.
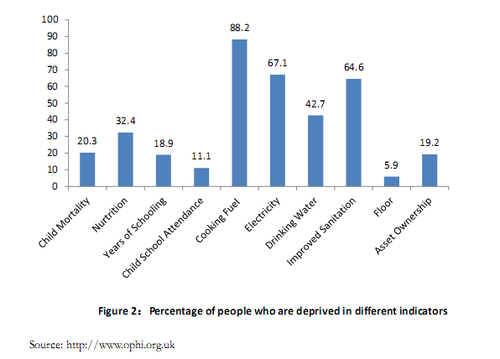
As for the indicators of multidimensional poverty, based on the three dimensions 10 indicators, 88.2% of the households cannot use clean cooking fuels, 67.1% of the households have no access to electricity and 64.6% of the households cannot use improved sanitation facilities. From the perspective of health, there is also a severe poverty phenomenon. 32.4% of the households have family members, who suffer from malnutrition.
3. CHALLENGES FOR POVERTY REDUCTION IN CAMBODIA
3.1 CHALLENGES FOR AGRICULTURAL DEVELOPMENT
In Cambodia, about 85% of the people make a living on farming. Cambodia has an arable land area of about 6.7 million hectares, but the actual acreage under cultivation is only 2.6 million hectares. Farming industry has a huge development potential. In addition to planting, the output value of aquaculture, livestock breeding and rubber industries also accounts for a certain percentage of Cambodia's agricultural output value. The main crop in Cambodia is rice, and people also plant some cash crops. In addition, the 460 kilometers of coastline in Cambodia provides good natural conditions for marine fishing and aquaculture. Meanwhile, the good climatic conditions in Cambodia provide favorable natural environment for the development of livestock farming, which is also an agricultural area to be developed. Rubber industry, moreover, not only is an important growth point for agricultural economy in Cambodia, but also can boost the development of agricultural circular economy.
Despite an annual growth in the Cambodian agricultural acreage, the yield per unit is not high. Due to the use of destructive fishing nets, aquaculture industry has not developed well. Overfishing, moreover, destroyed the ecological balance, and avian influenza brought a great impact on livestock and poultry industry. In 2004, the rubber tapping area in Cambodia was 23,787 hectares, down 11% as compared to 2003; adhesive output was 25,928 tons, down 20% as compared to 2003. The decrease in rubber tapping area is a result of the rubber tree updating, and the yield declined mainly because the rubber trees are aging year after year and suffering from diseases due to drought.
The slow development of agriculture in Cambodia is largely because of the low productivity, which means that the farming method is basically at the stage of extensive cultivation with low yield relying on natural conditions. The agricultural yield is rather low, only 1.97 tons per hectare due to the backward agricultural infrastructure and inability to resist droughts and floods. In addition, the financial and technological investment is insufficient. The central and local government can barely pay the salaries of administrative staff of agricultural sector, and the enhancement of high-tech content in agricultural production can only rely on the operation of the market mechanisms or the aid and foreign investment from other countries.
3.2 CHALLENGES FOR EMPLOYMENT PROMOTION AND PRIVATE
SECTOR
The most important characteristic of Cambodia's labor market is excess ordinary workforce with a saturation point in terms of demand. 55.5% of the Cambodian people are labors and the labor force growth rate was about 2.7%. Due to the incomplete industry categories, however, few industries can address the employment problem of the workforce, and the domestic labor market is unable to absorb these labors or provide jobs for 250,000 young Cambodian people flowing into the labor market every year. Labor export, therefore, is also a characteristic of Cambodia's labor market. With the ending of the GSP provided by the WTO "Agreement on Textiles and Clothing", the domestic textile and garment industry, which was most attractive to workforce, is now saturated and shows a tendency to move overseas, so it is impossible for this industry to create more jobs. The domestic employment situation, therefore, is grim, and there are few opportunities to promote employment.
Due to the low level of education and little government investment in labor trainings, the extreme lack of skilled workers and senior technical personnel is another characteristic of the Cambodian labor market. The continuous depreciation of general workforce and a trend of increasing competition also make it very difficult to find employment opportunities.
In short, the low educational level, incomplete infrastructure and low levels of labor force have brought great challenges to employment promotion and the development of private businesses.
3.3 CHALLENGES FOR SOCIAL DEVELOPMENT
In the field of education, according to estimates, the illiteracy rate of the 15-60 year-old people is 6% and the school enrollment rate of the children aged 15-17 is only 23%. In the villages or communities, few opportunities are provided for people to take part in professional skills training or education. In rural areas, illiteracy and lack of educational resources (particularly for girls) hinder the development of the residents.
As for health and sanitation, 42.7% of the drinking water sources are unsafe, malaria and other diseases are rampant, and especially in rural areas, the infant mortality is fairly high. In Cambodia, the body weight loss rate of the children under 5 years of age increased from 8.4% in 2004 to 8.9% in 2008, and then up to 10.9% in 2010. The prevalence of malnutrition among these children, however, fell from 43.2% in 2005 to 39.5% in 2008, but this is still a shocking figure, combined with high child mortality, hindering the development of children's intelligence and affecting their future education and ability to create. All these will finally hinder the national economic growth. At present, the maternal mortality rate is 0.204%, which needs to be urgently reduced. In addition, because of poor health conditions and the movement of people in recent years, the situations of AIDS and other infectious diseases have become increasingly serious, but the cost of medical treatment is very high.
4.CAMBODIA'S POVERTY REDUCTION SECTORS AND PRO-POOR
STRATEGIES
In 1993, Cambodia established a new government and implemented the free-market economic reform and opening-up policy. Over the two decades, Cambodia has made outstanding achievements in foreign trade, foreign investment and foreign aid, which are the important "engine" of its domestic high economic growth. Among them, foreign aid has the most significant economic effect, followed by foreign trade and foreign investment50. Cambodia's Ministry of Planning is responsible for poverty reduction and formulated three major pro-poor strategies - "Socio-economic Development Plan" (1996-2000, 2001-2005, 2006-2010), "Cambodia's Millennium Development Goals" and "National Poverty Reduction Strategy". In recent years, meanwhile, Cambodia increased efforts on attracting foreign investment, learned from China's experience in establishing economic zones and implemented the development-oriented poverty reduction strategy. It has determined the poverty reduction goals: According to the Millennium Development Goals, the Cambodian government plans to reduce its poverty rate to 20%, with an annual decline of more than 1%. Its poverty reduction strategy consists of six parts:
4.1 TO IMPROVE THE LIVING CONDITIONS IN RURAL AREAS
To improve the productivity and overall quality of life in rural areas, Cambodia put forward the ollowing strategic objectives:
(1) To improve the productivity of agricultural sector. Strategic objectives include: To increase production of crops, livestock, forestry, fisheries and rubber industry and invest more in agricultural production departments; promote agricultural mechanization and animal traction; guarantee the effective and rational use of and sustainable access to natural resources; respond to natural disasters and climate change; and improve regional planning and land management mechanisms; (2) To reduce the poverty rate in rural areas. Strategic objectives include: To enhance the level of education, and strengthen infrastructure construction; improve financial services in rural areas, especially for women; improve the education level and overall quality of rural productive forces; expand rural low-interest credit to promote rural economic growth; (3) To improve food safety and health conditions. Strategic objectives include: To reduce the prevalence of malnutrition among children and increase children's nutritional intake to improve their nutritional status; to ensure food security and increase government investment in health care to reduce mortality.
4.2 TO ACHIEVE MACROECONOMIC STABILITY AND SUSTAINED
ECONOMIC GROWTH
Realizing that macroeconomic policies, such as public finance and monetary and financial 50Zheng Guofu, "An Empirical Study of the Relationship Between Foreign Trade, Foreign Investment and Foreign Aid & Domestic Economic Growth in Cambodia", "Economic Forum", 2014, No.4, Page163-166. policies play a crucial role in promoting national development and stability, Cambodia put forward the following strategies:
(1) To strengthen the management of financial sector. Strategic objectives include: To increase fiscal revenue through sustainable and equitable approaches; give priority to poverty reduction in the allocation of special public resources; promote investment and financing through sustainable approaches; close down nonviable banks; privatize Foreign Trade Bank and unify the bank accounting standards; (2) Monetary and exchange rate policies. Strategic objectives include: To intensify the management of foreign exchange reserves and trade; strengthen macroeconomic stability and sustained economic growth; (3)To create a relaxed environment for sustainable development. Attach great importance to the development of four priority areas: human resources development and vocational and technical trainings of youth; continue to invest in infrastructure; further improve trade coordination and capacity building of government institutions; continue to develop electrical energy industry focusing on promoting irrigation system construction and development of agriculture. To maintain its competitiveness in attracting foreign capital and improve the investment environment, under the leadership of the Cambodian Development Council (CDC), the government set up the working groups in ten specialized areas to solicit opinions from all sides, amended the investment law, abolished the "General Certificate of Origin (CO)" and simplified company registration procedures. In 2014, it began to advocate online application for company registration, greatly improving the business environment of the country. According to the statistics of the Cambodian Ministry of Commerce, 1066 companies were registered in the first quarter of 2014, an increase of 76% as compared with the figure of the previous year (606). Special Economic Zone has also become a new economic growth point of Cambodia. As of the end of 2013, 32 special economic zones were approved in principle to be invested in Cambodia (8 invested by Chinese enterprises), of which 20 were approved to be established. 44 new investment projects were launched in the special economic zones with an investment of $ 187 million, creating 19,243 jobs.51
4.3 TO CREATE EMPLOYMENT OPPORTUNITIES AND PROMOTE THE
DEVELOPMENT OF PRIVATE SECTOR
It is a strategic direction of the Cambodian government to promote employment through the development of private economy. The Cambodian government aims to achieve this goal through the following strategies:
(1) To encourage job creation. To promote the development of SMEs, and attract domestic and foreign labor-intensive investment; improve SME credit services; promote the development of labor-intensive industries; ensure labor-intensive public works can provide low-cost temporary jobs; (2) To improve the quality and skills of labor force. To improve the quality of vocational training in urban and rural informal employment sectors, strengthen skills training to increase employment opportunities; promote linkages between demand and supply of employment; (3) To promote the development of private sector to ensure social and economic growth. To increase support for private sector, and increase investment and spending; strengthen legal construction to guarantee the 51The economic and Commercial Counsellor's Office of the Embassy of P.R.C in Cambodia, "Cambodia's Macroeconomic Situation in 2013 and Forecasts for 2014"
http://cb.mofcom.gov.cn/article/zwrenkou/201404/20140400563948.shtml
legitimate interests of private businesses; promote private sector's investment diversification, reduce transaction costs, create and maintain critical government facilities and establish a reasonable supervision framework for the operation of the private sector.
4.4 TO ENHANCE THE LEVEL OF INSTITUTIONAL MANAGEMENT AND
GOVERNMENT GOVERNANCE
Good governance is also regarded as an important strategic direction, so the following strategies are created:
(1) Local governance and decentralization. To implement specific legal and judicial reform, accelerate public administration reform and capacity building of local administration, and decentralize authority; promote macroeconomic stability, accelerate urban development; strengthen citizen participation in governance and give people the freedom of speech. (2) To strengthen democracy rule of law. To ensure justice for all citizens, especially those at a disadvantage economically. (3) To improve the quality and availability of public services, use the information network to improve the efficiency of public services, invest a lot in infrastructure; improve the quality of government services, make the services efficient and transparent with a broader scope of services. (4) To fight against corruption. Enhance transparency and accountability; strengthen internal and external control mechanisms; and prevent and control crimes, in particular the prevention of corruption and embezzlement.
4.5 POPULATION POLICY
To enhance the demographic dividend in Cambodia, the Cambodian government attaches importance to the strategies for education and health development:
(1) To strengthen the people's education and improve the health status of the people to ensure that people enjoy the right to information, create an environment for revealing people's potential through good government control. (2) To support reproductive freedom of couples and allow them to choose the time to give birth and the number of children. (3)To reduce mortality, especially infant, child (under five) and maternal mortality, and extend the average life expectancy. (4) To reduce youth unemployment and take legal and other measures to prevent young people from drug abuse. (5) To establish a national population development committee to promote the implementation of the national population policy.
4.6 GENDER POLICY
Women play an important role in poverty reduction and development. Cambodia issued the following strategies to enhance the status of women and to promote gender equality:
(1) To ensure equal rights for men and women to obtain goods and enjoy services. (2) To ensure equal participation and men to benefit from the labor market, policies, institutions, education, health care, etc., and vigorously improve maternal health care. (3) To develop the consciousness of advocating gender equality and make the concept of gender equality penetrated into all walks of life. (4) To force people accept the concept of gender equality from the legal perspective, protect women's rights and interests and develop relevant laws to guarantee gender equality, such as the "Domestic Violence Act" and the "Anti-trafficking Law".
References
Chen Jiang, He Qian, Smiling Khmer, Silent China, China's Real Presence in Cambodia, "Southern
Weekend", http://www.infzm.com/content/41820
The Economic and Commercial Counsellor's Office of the Embassy of P.R.C in Cambodia,
"Cambodia's Macroeconomic Situation in 2013 and Forecasts for 2014",
http://cb.mofcom.gov.cn/article/zwrenkou/201404/20140400563948.shtml
Zheng Guofu, "An Empirical Study of the Relationship between Foreign Trade, Foreign Investment
and Foreign Aid & Domestic Economic Growth in Cambodia", "Economic Forum", 2014, No.4,
Page163-166.
Hong Sen: Trade Cooperation between China and Cambodia, CCTV Website,
http://jingji.cntv.cn/2013/05/11/VIDE1368260400338890.shtml
Melanie Beresford, NguonSokha, Rathin Roy, SauSisovanna andCeemaNamazie2004, The
Macroeconomics of Poverty Reduction in Cambodia, available at
http://200.252.139.146/publications/reports/Cambodia.pdf
Olli Varis and Marko Keskinen 2003, Socio-economic Analysis of the Tonle Sap Region, Cambodia:
Building Links and Capacity for Targeted Poverty Alleviation, International Journal of Water
Resources Development, Vol 19, No 2.
Sophal Ear 2007, The Political Economy of Aid and Governance in Cambodia, Asian Journal of
Political Science, Vol15, No 1.
Tomoki Fujii 2008, How Well Can We Target Aid with Rapidly Collected Data? Empirical Results for
Poverty Mapping from Cambodia, World Development, Vol 36 No 10.
UNDP, Cambodia´s Diagnostic Trade Integration Strategy 2014-2018: Executive Summary,
http://www.kh.undp.org/content/dam/cambodia/docs/PovRed/Executive%20summary%20-%20C
ambodia%20Trade%20Integration%20Strategy%202014-2018_Eng.pdf
50
CHAPTER 4 INDUSTRIAL STRUCTURAL UPGRADING AND
POVERTY REDUCTION IN CHINA
Justin Yifu Lin52 and Miaojie Yu53
1. INTRODUCTION
In the three decades of economic reforms since 1979, China has successfully maintained a 9.9% annual gross domestic product (GDP) growth rate and registered a 16.3% annual growth rate for international trade (Lin, 2010). China has already taken over Japan as the second largest economy in the world, and it will become the largest economy by the 2020s in terms of purchasing power parity.54 Even if China was negatively affected by the recent global financial crisis, China still surpassed Germany as the largest exporter in the world in 2009, and it is currently recognized as the largest “world factory.” China has also succeeded in reducing poverty. In 1979, China was one of the poorest agrarian countries in the world, with a per-capita annual income of US$243 at 1979’s exchange rates55, which was about one-third of the average in Sub-Saharan countries. After only three decades, China’s per-capita GDP increased to approximately $5,000 in 2011, and China became an upper-middle income country, according to the classification of the World Bank.
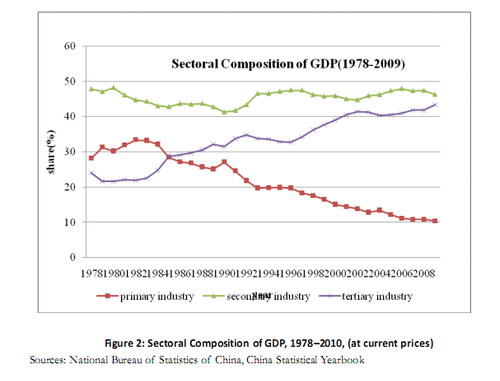
China’s rapid growth was achieved through a dramatic structural transformation, which can be observed from changes in the sectoral composition of GDP. In 1978, primary goods accounted for 28.2% of GDP, and agricultural exports for around 35% of China’s entire exports. In sharp contrast, the proportion of primary industry in China’s GDP today has shrunk to 11%, and agricultural exports only account for less than 3.5% of China’s total exports. With the declining share of agricultural goods, manufacturing exports have increased dramatically in the last three decades, increasing from 65% in 1980 to approximately 96.5% in 2009 (Yu, 2011a). Similar changes occurred in the composition of employment. The share of the labor force in primary industry declined from 70.5 percent in 1978 to 38.1 in 2009 whereas the labor force in secondary industry increased from 17.3 percent to 27.8 percent in the same period.
52 Professor of CCER, Peking University, and Former Chief Economist in the World Bank. Email:
Industrial upgrading is also a remarkable feature of China’s economy since its economic reform. As discussed later, China’s industrial upgrading exhibits four clear phases. In the first phase (1978 to 1985), China still relied on producing and exporting resource-based goods, such as oil and gasoline. The second phase (1986 to 1995) witnessed a fast growth of labor-intensive exports. In the third phase (1996 to 2000), the main export from China was electrical machinery and transport equipment. At the same time, China also imported a large volume of machinery. The increasingly important role of intra-industry trade can mainly be attributed to China’s successful industrial upgrading and the prevalent processing trade that aligned production with China’s comparative advantage. The latest phase, which began in 2001, has recorded a fast export growth in high-technology products, such as life-science equipment.
China’s successful structural transformation and industrial upgrading beg the question of how it developed from a backward, closed, and agrarian economy to an open, competitive world factory. In this chapter we will discuss what happened to China’s production structure and industrial upgrading. How did China successfully upgrade its manufacturing structure in the last three decades? What are the fundamental driving forces behind the transformation? Furthermore, to what extent did the rapid structural transformation and industrial upgrading help to foster employment and reduce poverty in China? Finally, what lessons can be learned from China’s successful structural transformation and industrial upgrading?
Our basic argument is that China’s rapid industrial upgrading and its consequent poverty reduction are mainly attributed to the adoption of an appropriate development strategy, which is a comparative-advantage-following (CAF) development strategy, driven by its factor endowments (Lin, 2003, 2009, 2012, Lin, et al., 2004). As China is a labor abundant country, the labor-intensive industries can be competitive and viable if the market is not distorted. The latent comparative advantage of the Chinese economy was suppressed before its economic reform because China’s government adopted a heavy industry-oriented development strategy. As such the development strategy was comparative-advantage-defying, China’s government set up an organic but deeply distorted system to support economic development with priority on heavy industries. Under this system, the prices of input factors and output were set by a planned administration system and were hence distorted. Firms were deprived of production autonomy and lacked incentives. Efficiency was low. Accordingly, the industrial structure could not be upgraded. As heavy industries are capital intensive and incapable of absorbing more labour, employment opportunities in the industrial sector were limited in spite of large investment. Finally, as the state required its puppet-like state-owned enterprises (SOEs) to squeeze as much profit as possible out of production, wages for workers were suppressed at a low level, and the prices of agricultural products were set with unfavorable terms of trade against peasants. Both forces made the Chinese people maintain a low living standard, and severe poverty could not be alleviated.
After its economic take-off, China adopted a CAF development strategy. The two main aspects of this strategy are both the adoption of the dual-track reform to provide temporary protection or subsidies to the traditional and old sectors and the encouragement to develop new viable sectors aligned with its comparative advantage driven by its factor endowments. The dual-track reforms, including price reform of output and input factor markets as well as foreign trade and exchange rate reforms, were essentially Pareto optimal. All reforms started by allowing the existence of two tracks, that is, one dominated by the state and the other oriented to the market. The two tracks subsequently converged and unified to a market track only. Similarly, to avoid the collapse of SOEs due to the shock of rapid reform, SOE reform began with granting management autonomy and then moved to institutional transitions. More importantly, new firms and industries aligned with China’s comparative advantage were greatly encouraged. The growth of China’s town village enterprises (TVEs) serves as an excellent example. The government’s successful growth identification and facilitation played a vital role in transforming its economic structures and upgrading its manufacturing structures because they overcame asymmetric information, coordination failure, and even externality appropriateness that are associated with market mechanism (Lin, 2012).
The structural transformation and industrial upgrading also have significant effects on employment generation and poverty reduction. With structural transformation, the share of the primary sector in GDP declined dramatically, and the shares of the secondary sector and, especially, the tertiary sector consequently increased. As a result, laborers moved out of the primary sector and earned higher wages in the secondary and tertiary sectors. With the correction of the distortion in input factors, the unfavorable terms of trade against the peasants were redressed. The boom of TVEs also provided more employment opportunities for rural people with high-income earnings. The government’s forceful facilitation in the rural area also improved both hard and soft infrastructures. The three factors mentioned above improved the living standard and dramatically reduced poverty in the rural area. The industrial upgrading also improved the living standards of workers in the urban area. With a CAF development strategy, labor-intensive industries developed rapidly, which in turn created new working opportunities. After three decades of reforms, SOEs were downsized in terms of numbers and output, but their performance was in a much better shape after efficiency increased and workers’ initiatives were stimulated. As a result, workers’ living standards were improved in the urban area, along with structural transformation and industrial upgrading.
Other developing countries can learn two main points from China’s economic miracle. First, to upgrade industrial structure successfully, a developing country must adopt a CAF development strategy based on its factor endowment. Second, despite a free, fair, and competitive market mechanism, governments of developing countries are suggested to play a proactive role in facilitating structural transformation and industrial upgrading. A useful framework for growth identification and facilitation with several key suggestions is provided and discussed in this study, as policy makers usually find identifying growth opportunities difficult.
The remainder of this chapter is organized as follows. Section 2 introduces the conditions faced by China’s manufacturing industry before China’s economic reform in 1978. Section 3 discusses the trends and characteristics of China’s industrialization and manufacturing structural upgrading since its take-off. Section 4 examines the main factors, namely, policy setting, accounting for rapid industrial growth, and structural upgrading. Section 5 investigates the effect of industrial growth and manufacturing structural change on employment generation, following a careful scrutiny of the relationship between shifts in manufacturing employment and poverty reduction. Based on China’s experience, Section 6discusses the main points that other developing countries can learn from China.
Finally, Section 7 concludes and provides some suggestions for China’s further reform.
2. CHINA’S ECONOMY BEFORE THE REFORM
Before its economic reform, China was a poor, agrarian economy. In 1952, agriculture accounted for 57.7% of China’s GDP and absorbed 83.5% of China’s employed labor. Per-capita GDP was very low. In particular, per-capita agricultural and industrial output was RMB143 (or equivalently $65 at 1952 price) 56 . Before the economic reform, a distorted industrial structure suppressed the development of China’s economy, which in turn generated a closed economy and deep poverty, and a distorted income distribution.
Similar to the leaders in many other developing countries established after World War II, China’s leaders adopted a heavy-industry oriented development strategy after gaining political independence in 1949. However, heavy industries are capital-intensive, and China was essentially a capital-scarce agrarian economy. Such stark difference between factor endowments and development strategy made allocating resources through the market mechanism impossible for China. Instead, a development strategy that prioritized heavy industry, which is a comparative-advantage-defying (CAD) strategy, distorted product and factor prices, and it had to rely on a highly centralized planned resource allocation mechanism. Correspondently, the government had to set up a puppet-like micro-management system. These three elements in China’s economy before its reform are referred to as the trinity of the traditional economic system (Lin et. al, 2004) and introduced as follows.
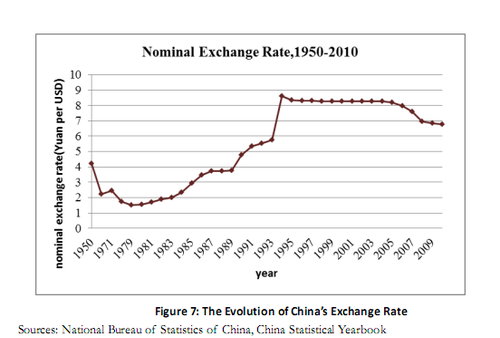
First, China’s government had to distort macroeconomic policies that suppressed interest rates, exchange rates, wages, prices of raw materials and intermediates inputs, and even agricultural prices to perform its heavy industry-oriented development strategy (Lin, 2003). Projects in heavy industries require much capital, which was scarce in China. In response to the strong demand for capital, the government had to control interest rates to reduce the cost of capital. In addition, heavy industries also require capital-intensive intermediate goods and equipment, which had to be imported because China, an agrarian economy, could not produce such goods at that time. Therefore, sufficient foreign exchange reserves are a priori for projects on heavy industries. However, foreign exchange in China was also scarce because China’s exports, if any, were limited to natural resources and low value-adding agricultural products before the economic reform. China’s government had to overvalue its own currency against the dollar to lower the cost of imported intermediate inputs. China appreciated its currency (RMB) from RMB4.2 per dollar in 1950 to RMB1.7 per dollar, a 250% appreciation during this period.
Raising sufficient funds to support heavy industries was difficult because China was an agrarian economy. The only way to accumulate capital for heavy industries is to reduce the cost of various input factors. In accordance with the suppression of the interest rate, the government also set low nominal wages for urban workers. The wages were independent of the workers’ effort, but the wages varied by rank and seniority. Before 1978, the average annual wage was approximately RMB550 (or equivalently $223 at 1971’s exchange rate). The artificially low wages held down the purchasing power of urban workers. If prices of agricultural goods and necessities were set by the market, urban workers would not have been able to afford most of the products. Therefore, the government had to generate “price scissors” in favor of urban workers against rural peasants by setting very low prices on agricultural goods (Lin and Yu, 2008). Simultaneously, China’s government also adopted a very rigorous residency control system, known as hukou, to prevent rural workers from migrating to urban areas in search of jobs. This control system was enforced starting in 1958.
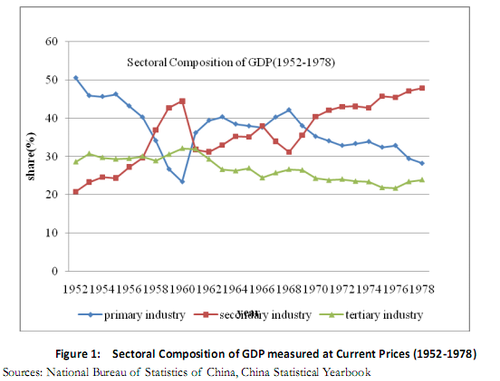
Second, a highly centralized planned resource allocation mechanism was established. Excess demand occurred in each factor market because the government artificially distorted the prices of products and various input factors. Hence, a market-based resource allocation mechanism was unable to clear the market given that prices were fixed. In response to such excess demand, the government 56Sources: China’s Statistical Yearbook (2011), Author’s own calculation. had to ration resources through a series of planned administrative means. A good example is the foreign trade system. Given an artificially high exchange rate, firms found exporting impossible because they were uncompetitive in the international market. However, if no firms exported, limited foreign reserves would soon dry up. Hence, China could not import necessary equipment and intermediate inputs. To avoid this situation, the government was forced to impose a monopoly over foreign trade by setting up the Ministry of Foreign Trade, which in turn authorized 12 nationwide specialized foreign trading companies. These trading companies served as an “air-lock” to isolate China from the world economy and to monopolize the entire country’s foreign trade. In addition, the government also established the People’s Bank of China to ration funds and set up the State Planning Commission to manage raw materials and natural resources. Finally, in accordance with such a distorted institutional arrangement, China’s government also adopted a corresponding micro-management system. In particular, SOEs were established in urban areas even though People’s Communes were established in rural areas. Price distortions of input and output factors were set to accumulate capital, which is essential for the success of the heavy industry-oriented development strategy. If firms were private-owned, they could allocate profits among owners but not accumulate much capital, which could ruin the heavy industry-oriented development strategy. Hence, the type of ownership must be state owned. Moreover, even if an SOE were granted autonomy in management, its workers would also deviate from the heavy industry-oriented development strategy, as the objective of a firm is to maximize profit. Therefore, the state had to deprive SOEs of any autonomy and adopted a puppet-like management. Agricultural production in the rural area was mandated through the People’s Communes to guarantee that the state could monopolize purchasing and marketing of agricultural products. This was done to ensure further that the state could accumulate sufficient capital for heavy industries (Lin, 1990). Thus, an economic system for the heavy industry-oriented development strategy was established. The distortions of factor prices enabled the enterprises to reduce their input cost and to realise profits as much as possible, which in turn were used to accumulate capital. The highly centralized planned resource allocation mechanism guaranteed that limited natural resource would flow into the heavy industries. Correspondingly, a puppet-like micro management system was used to make such arrangements smooth and successful. However, as mentioned previously, the heavy industry-oriented development strategy is CAD given that China was an extremely capital-scarce country before its economic reform (Lin, 2003). A CAD strategy can lead to a distorted industrial structure and can make it difficult for the economy to upgrade its manufacturing structure. Clearly, the CAD strategy cannot create sufficient employment and leaves the workers with a very low standard of living. It is interesting to ask to what extent the CAD development strategy laid the foundations for the later successful transformation of the Chinese economy. Due to data restrictions before 1978, few studies, if any, provide a direct answer to that question. Yet, as found by Hsieh and Klenow (2009), even today, there still exist sizable distortions in the factor markets caused by the CAD strategy (Lin, 2003). If such distortions were corrected, total factor productivity (TFP) of Chinese manufacturing firms would increase at least 25%. The answer to such an empirical question is far from conclusive. Still, we are able to capture the distortions before the economy reforms indirectly. For example, Figure 1 suggests a severe distortion occurred in China’s industrial structure from 1952 to 1978. The GDP share of the manufacturing sectors increased dramatically from 19.5% in 1952 to 49.4% in 1978. Simultaneously, agricultural sectors exhibited a declining trend from 57.7% in 1952 to 32.8% in 1978.
However, both tertiary sectors and non-manufacturing secondary sectors declined during the same period, suggesting that the share of manufacturing increased at the expense of the primary sector, the non-manufacturing secondary sector and the tertiary sector. Of course, the fact that industry increases its share of GDP and agriculture reduces its share is in itself not an indicator of distortion. However, given that China’s per-capita GDP was still at the extremely low level (US$243 at 1979’s exchange rates), the high manufacturing share of GDP suggest that t=China’s economy wasdistorted. This can be verified from two perspectives. First, within the manufacturing sector, the proportion of heavy industries increased from 35.5% in 1952 to 56.9% in 1978.Second, the investment allocation within manufacturing sectors was also skewed toward infrastructure investment. In particular, the infrastructure investment ratio (i.e., investment in heavy industries divided by that in light industries) increased from 5.7 during the First Five-year Plan period (1953 to 1957) to 8.5 during the Fourth Five-year Plan period (1971 to 1975).
Heavy industries are incapable of absorbing additional labor because these industries are capital intensive per se. Although heavy industries accounted for a quarter of China’s GDP in 1978, employment in such sectors only accounted for 7.9%. In contrast, light industries can usually absorb more labor because they are labor intensive. Light industries absorbed 4.6% of labor employed in 1978 and accounted for 3% of China’s GDP. Simultaneously, more than 73% of the labor force was still in the agricultural sectors before the economic reform. Moreover, because prices of agricultural goods were artificially suppressed by “price scissors,” rural peasants were not able to increase their income with the growth of heavy industrialization. Accordingly, even after two decades of implementation of the heavy industry-oriented development strategy, China was still the least developed country in the world, with a per-capita GDP of RMB381 (equivalently $221 at the 1978 exchange rate) in 1978.
In summary, China adopted a heavy industry-oriented development strategy before 1978, which was inconsistent with China’s latent comparative advantage based on its factor endowments. As a result, the implementation of the CAD strategy not only distorted China’s industrial structure but also did not improve the people’s living standards.
3. CHINA’S INDUSTRIAL GROWTH AND STRUCTURAL UPGRADING
Since its economic reform in 1978, China abandoned the heavy industry-oriented development strategy, adopting the CAF development strategy based on its factor endowments. Given that China is a labor-abundant but capital-scarce country, China will gain from trade if it follows its comparative advantage by exporting labor-intensive products and importing capital-intensive products according to the Heckscher–Ohlin theory. However, China’s government had to increase its efforts to correct existing distortions, as China had a highly distorted industrial structure due largely to the adoption of a comparative-advantage-defying strategy. This will be discussed in the next section. In this section, we instead focus on the trends and characteristics of China’s structural transformation and industrial upgrading since its take-off.
We begin by examining the pattern and evolution of China’s sectoral composition, in which special attention is given to the dynamic structural transformation over time. We also explore the revealed comparative advantage for each manufacturing sector. We then discuss the value-chain upgrading across and within manufacturing sectors. Given that international trade plays a dominant role in the Chinese economy since its take-off, a careful scrutiny of intra-industry trade suggests that China’s intra-industry trade is the result of processing trade, which refers to importing raw materials to be assembled in China, indicating that the high intra-industry trade essentially follows China’s comparative advantage.
3.1 STRUCTURAL TRANSFORMATION
The GDP sectoral composition of China witnessed an industrial structural change before and after the economic reforms in the last three decades. By insisting on a comparative-advantage-defying development strategy, secondary industries such as the manufacturing sectors could maintain their fast upward trend as cases before 1978 shown in Figure 1. However, this changed after 1978, as shown in Figure 2. The share of secondary industry in GDP remained the same but the share of the manufacturing declined slightly in the last three decades. In sharp contrast, the share of tertiary industry increased from 23.9% in 1978 to 42% in 2010. Moreover, the GDP share of the primary industry declined from 28.3% in 1978 to only 11% in 2009.
For the components of the manufacturing sectors, the share of labor-intensive light industries increased from 43.1% in 1978 to 48.9% in 1991. Correspondingly, the infrastructure investment ratio (i.e., investment in heavy industries divided by that in light industries) declined from 8.5 during the Fifth Five-year Plan period (1978–1982) to 6.5 in 1991. These results suggest that China is moving away from a heavy industry-oriented development strategy to a CAF strategy. Since 1978, China has placed its development priority on labor-intensive industries based on their comparative advantage in factor endowments. This strategy is similar to the development strategies of the four “Little Dragons,” that is, or Korea, Taiwan, Hong Kong, and Singapore. In this way, China was able to explore its latent comparative advantage and increase its export volumes of labor-intensive products.
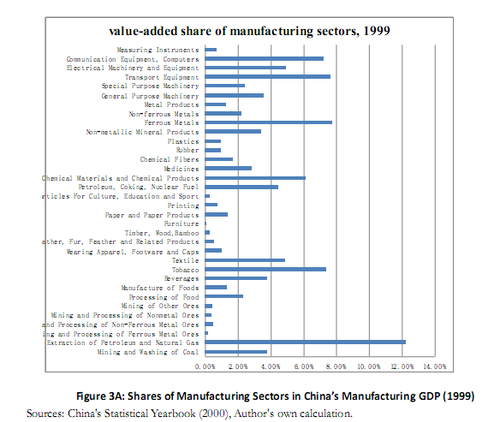
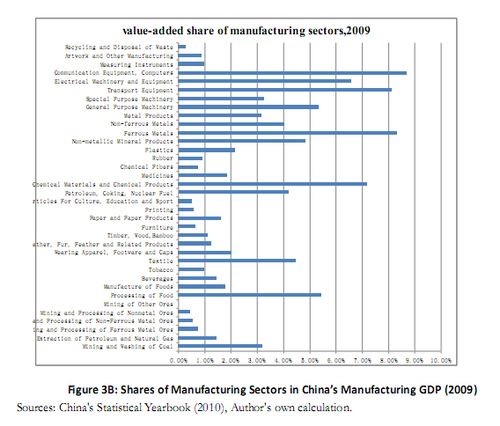
It is evident to observe China’s structural transformation from changes in shares of manufacturing sectors in manufacturing GDP. As shown in Figure 3A, in 1999 the extraction of petroleum and natural gas is the industry with largest share in manufacturing GDP (12.3%). After a decade, China’ shares of manufacturing sectors in manufacturing GDP are changed dramatically. In 2009, the share for extraction of petroleum and natural gas is reduced to only 1.47%, the share for communication equipment instead becomes the largest manufacturing sector, registering a 8.7% of China’s manufacturing GDP, as shown in Figure 3B.
3.2 VALUE-CHAIN UPGRADING
The growing foreign trade of China is an ideal window to examine its value-chain upgrading. Before its economic reform, China was a closed and backward economy. The trade dependence (or ratio), defined as the sum of exports and imports over GDP, was only 10%. However, it increased by more than six times in three decades. In 2008, the openness ratio of China reached 67%, compared to 25% in the US. Despite the negative demand shock of the recent financial crisis, China surpassed Germany as the largest exporter in 2009 and became the second largest importer in 2011.
The fast growing foreign trade of China is an economic consequence of adopting the CAF strategy (Lin et al., 2004). This argument can be clarified further by the dynamic evolution of manufacturing upgrading. Given that China transformed into an open and outward-looking economy since its reform, the composition of its exports is an appropriate reflection of manufacturing upgrading. In the last three decades, China’s exports exhibited four different phases.
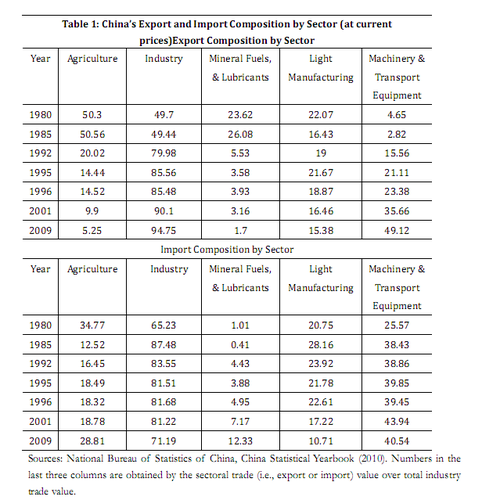
Table 1 show that the most important export was still agricultural products with 50.3% in 1980. Strikingly enough, in the first phase (1978–1985), the most important industrial exports of China were low value-added mineral fuels, such as petroleum, oil, and other natural resources. The key reason behind this situation is that such petroleum products milled from one of its main field in Daqing, Heilongjiang, increased during the period of 1978–1980. The government was aware of the importance of promoting labor-intensive industries, such as textiles and garments, but the magnitude of exports from light industries was still small. Mineral fuels, lubricants, and related materials accounted for 23.6% of the export market in China by 1980. This number climbed to 26% in 1985, higher than the 16% of light textile and rubber products, which were the second largest export category.
From 1985 to 1995, China produced and exported labor-intensive products such as textile, garments, and other light manufacturing goods as the CAF development strategy was implemented. In the second phase, textiles and rubber products took up a dominant proportion in the export package of China. Table 1 shows the 20% proportion during this period, with a peak at 21.6% in 1995.
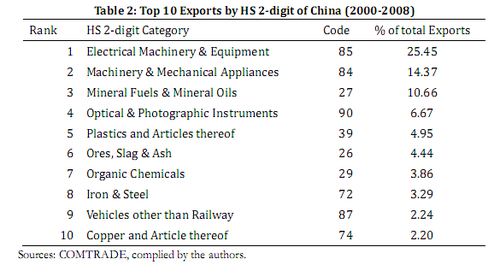
Interestingly, China exported US$35.3 billion of transport equipment machinery in 1996, which is larger than the US$28.5 billion of light manufacturing goods for the same year. This finding indicates that China came to its third phase of exports. In the third phase, the most important exports were capital-intensive products such as machinery and transport equipment. Table 2 provides more evidence on the structural upgrading experiments of China in the new century. The difference between the second phase and the third phase is that the main exports of China shifted away from the standard labor-intensive products, such as textiles and garments. By the beginning of the 21st century, low value-added and labor-intensive products were no longer in the top 10 exports of China. Currently, the top exports of China are electrical machinery and equipment, followed by machinery and mechanical appliances. Although mineral fuels and mineral oils made their way back into the top ranks of exports, they were different from their counterparts three decades earlier. The current mineral fuel industry had a very high value-added output ratio of 77.7% in 2007, higher than its counterpart of 26.2% in 2007 for textiles. These top three industries account for more than a half of the entire exports of China.
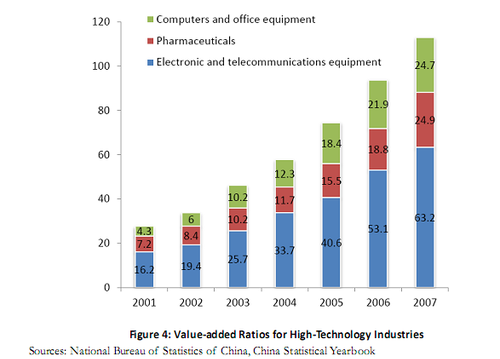
Perhaps the most interesting observation comes from the fourth phase. In 2001, China joined the World Trade Organization (WTO). In the latest phase, China exported a high volume of high-technology products, such as aerospace, computers, pharmaceuticals, scientific instruments, and electrical machinery. By 2007, high-technology product exports accounted for 30% of the entire manufacturing exports of China and 18.1% of the world’s high-technology exports (Yu, 2011). Such high-technology industries are associated with a high value-added output ratio, which is defined as the difference between final output and intermediate inputs divided by the final output. Figure 4 shows the value-added ratios for all three high-technology industries that exhibit fast growth rates. In particular, the value-added ratio of computer and office equipment increased from 4.3 to 24.7, a more than five-fold increase.
Therefore, the four phases of the economic reform in China demonstrate how a manufacturing goods experiment led to a value-chain upgrading of exports, that is, from primary goods to machinery, transport equipment, and even high-technology products.
3.3 DYNAMIC EVOLUTION OF COMPARATIVE ADVANTAGE
Given that China exports huge volumes of machinery and transport equipment, questions have emerged about its comparative advantage in such products. An affirmative answer about comparative advantage supports the argument that China has adopted a CAF development strategy. Otherwise, one may argue that such a CAF development strategy is not evident in China.
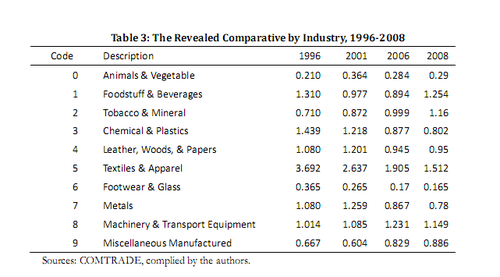
Table 3 provides the indices of the revealed comparative advantage (RCA) at the HS 1-digit level for China in the new century. If an industrial RCA index is greater than one, the industry has a comparative advantage in the world market. In 1996, China had a comparative advantage on industries such as foodstuff and beverage, chemical and plastic, leather, wood and paper, and metal. Among these categories, textiles and apparel had the strongest comparative advantage at 3.692. The comparative advantage of this industry declined in the new century. However, it maintained significant comparative advantage in 2008 with a RCA of 1.512. Equally important were machinery and transport equipment, which began to exhibit a slight comparative advantage in 1996. In contrast with that of textiles and apparel, the comparative advantage of machinery and equipment increased over time. Currently, China boasts of significant comparative advantage in the following industries (in descending order): textiles and apparel, foodstuff and beverages, tobacco and minerals, and machinery and transport equipment. Nevertheless, main idea of Table 3 is that China experimented on the dynamic evolution of comparative advantage. By producing and exporting more goods in accordance with its dynamic comparative advantage, China successfully upgraded its industrial structure.
Also, it is worthwhile to stress that successful economic transformation and manufacturing upgrading also requires a country to adopt a CAF development strategy based on its current comparative advantage (Lin et. al, 2004). Note that the government provides a very important role to identify the industries that is consistent with a country’s comparative advantage. Without the appropriate role of the government, following static comparative advantage has the risk of freezing a country into a certain stage of development, as suggested by Amsden (1989) from Korea’s experience. By contrast, if the government can facilitate and identify the industries that follow a country’s comparative advantage, the CAF development strategy also automatically follow a country’s dynamic comparative advantage (Lin, 2012). 57
3.4 INTRA-INDUSTRY TRADE AND PROCESSING TRADE
Owing to its successful economic reform, China maintained an annual 9.9% GDP growth rate in the last three decades. As its economic size increased, its factor endowment changed. At present, China is the second largest economy in the world. Its GDP per capita reached US$5,000 in 2011, which is slightly higher than the threshold for higher-middle income countries. Therefore, understanding how China can produce and export larger volumes of capital-intensive products, such as machinery and transport equipment, compared with other countries with similar per capita income levels is difficult (Rodrik, 2008).
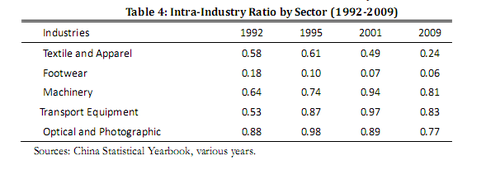
A hypothesis attributes this phenomenon to the prevalence of intra-industry trade. Compared with textile and apparel, machinery and transport equipment generate more intra-industry trade. The intra-industry trade index is commonly used to measure the level of intra-industry trade. It is defined as 1-|X-M|/(X+M), where X is the industrial exports, and M is the industrial imports. If the index equals one, then there is a huge volume of trade within this industry, as exports equal imports. Conversely, a zero index indicates that no intra-industry trade occurs in the industry. Table 4 illustrates that industries such as machinery, transport equipment, and optical and photographic products have high levels of intra-industry trade. In particular, the index of intra-industry trade for machinery and 57 I benefit much for the discussion with Adam Eddy Szirmai and Justin Yifu Lin at this point. transport equipment increased to 0.94 and 0.97 in 2001, respectively. In sharp contrast, intra-industry trade in labor-intensive industries, such as textile and footwear, was not so prevalent.
However, it is questionable whether the prevalence of intra-industry trade in capital-intensive industries, such as machinery and transport equipment, is the consequence or the cause of economic development. After its economic reform, China adopted a CAF development strategy. The government realized that processing trade is an ideal way to implement the CAF strategy given that China is a labor-abundant country. Indeed, processing trade is one of the main causes of the high level of intra-industry trade among the capital-intensive industries mentioned above.
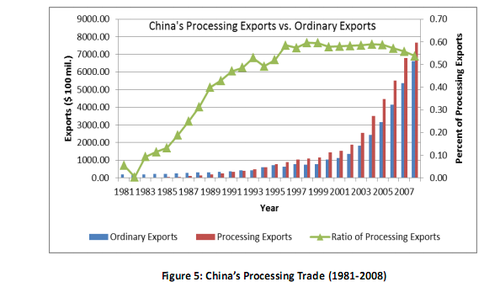
In processing trade, a domestic firm initially imports raw materials or intermediate inputs from a foreign firm. After the materials undergo local processing, the domestic firm exports the value-added final goods. Figure 5 shows how processing exports have accounted for half of the entire export of China since 1995. Among the 20 types of processing trade in China, the two most important types are processing trade with assembly and processing trade with purchased inputs. For processing with assembly, a domestic firm obtains raw materials and parts from its foreign trading partners without any payment. After local processing, the firm “sells” its products to the same firm by way of an assembly fee (Yu, 2011b). This type of processing trade was popular in the 1980s because of the lack of capital to pay for the intermediate imports among Chinese firms. The local firms took advantage of the abundant and cheap labor in China. Hence, industries engaged in processing trade are mostly labor intensive. Clearly, such type of processing trade is a typical CAF activity.
In the 1990s, processing exports with purchased inputs became more popular. A domestic firm imports and pays for the raw materials and intermediate inputs. After local processing, the local firm sells its final goods to other countries or foreign trade partners. Industries that typically engage in this type of processing trade are capital-intensive industries such as machinery and transport equipment. Chinese processing firms import complicated intermediate inputs and core parts from Japan and Korea. They assemble the final export goods using the comparative advantage in labor of China. As a result, a large proportion of China exports consists of machinery and transport equipment.
Concurrently, China imports a large volume of machinery and transport equipment, as shown in Table 2, resulting in a high level of intra-industry trade. Therefore, processing with inputs is still in accordance with comparative advantage driven by factor endowments.
3.5 INDUSTRIAL PRODUCTIVITY GROWTH
We have seen much evidence on the structural transformation and industrial upgrading of China, especially from its trading sectors. However, it remains unclear whether the structural transformation and industrial upgrading come from “extensive” growth through expansion of capital or labor inputs or “intensive” growth driven by productivity growth58. In theory, firms have incentives to maximize profit by increasing productivity through processed innovation under a CAF development strategy. Compatibility between this theory and the reality of China is worth verifying.
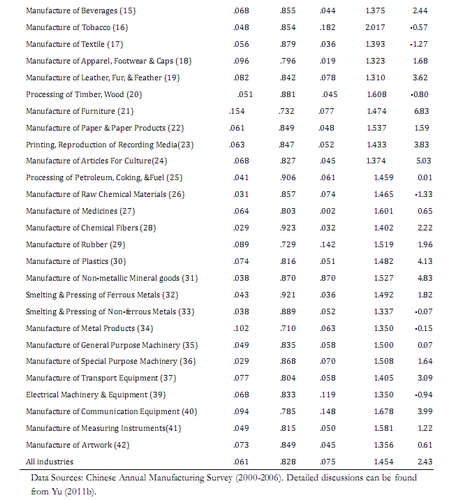
Table 4 presents total factor productivity (TFP) levels and growth rates for Chinese firms, with annual sales higher than RMB5 million (approximately US$770,000) from 2000 to 2006. To obtain accurate TFP estimates, we adopt an augmented Olley–Pakes (1996) approach to overcome the possible simultaneity issues and selection bias of the usual ordinary least square estimates, such as the Solow residual59. As expected, all manufacturing sectors exhibit positive productivity. The average TFP for all manufacturing sectors is 1.454, which supports the argument that Chinese firms experience technology improvements in the new century. Moreover, the average TFP growth rate is a high at 2.43 per cent. This result suggests that rapid productivity growth is a driving force of structural transformation and industrial upgrading in the new century. More importantly, industries such as transport equipment and communication equipment demonstrate higher TFP growth than do tobacco and textiles. This finding serves as additional evidence that China updates its manufacturing structure over time in accordance with changes in its comparative advantage.
4. HOW CHINA REALIZED STRUCTURAL TRANSFORMATION AND
IDUSTRIAL UPGRADI
The successful economic reform of China can be directly attributed to its “dual-track” strategy. On the one hand, the government provided transitional protection and subsidies to older sectors as a way of maintaining stability. On the other hand, the government adopted growth identification and facilitation to support entry to sectors consistent with the comparative advantage strategy to achieve dynamic growth. The dual-track reform strategy includes two important perspectives. One is the reform of micro-management institutions, which aims to provide more incentives for workers and foster production efficiency. The other is the arrangement of the “dual-track” price reform, which protects the old heavy industries and SOEs while encouraging the entry of industries that are consistent with the comparative advantages of China. Hence, the reform is a Pareto improvement perse. As a result, China has successfully upgraded its industrial structure in accordance with the dynamic evolution of its comparative advantages.
4.1 REFORM OF MICRO-MANAGEMENT ARRANGEMENT
As previously discussed, the economic system of China prior to its economic reform was an organic trinity. The government had to distort output prices and input factors to guarantee higher profits for enterprises and to help nonviable heavy industries develop. The artificially low and distorted prices created excess demand for output and input factors. Hence, the government had to adopt a planned administration system that directed the flow of limited resources into heavy industries. In addition, given that firm’s objective is to maximize profits, private firms would deviate from the development strategy set by the government. To avoid this, the government had to set up state-owned non-private firms and restrict their autonomy. The result was a demoralized workforce with no incentives and low productivity.
To improve workers’ incentives and foster production efficiencies, China began its reform from its micro-management system. In the rural area, the People’s Communes were replaced with the household responsibility system in which farmers were allowed to keep their production surplus after fulfilling state quotas. In this way, China successfully exploited its comparative advantage in agriculture, by providing initiatives for farmers. As a result, China achieved an annual growth rate of 6.05% in agriculture from 1978 to 1984 (Lin et al., 2004). Empirical studies such as Lin (1992) showed that the 46.89% increase in total agricultural products could be attributed to the household responsibility system.
In the urban area, the SOE reform underwent at least four stages in the last three decades. In the first stage (1978–1984), the SOEs were granted autonomy to improve their production efficiency by sharing profits and management duties with the state. The initial reform was successful, worker incentives were improved, and higher profits were generated. However, the reform raised a “rent-seeking” problem because of the unclear boundary of SOE autonomy. In the second stage (1985–1992), the government enhanced the SOEs’ vitality by reconstructing an appropriate management mechanism conducted by changing the policy of profit remittance to corporate taxes and replacing direct fiscal appropriation to indirect bank loans. Both policies were set to delineate the boundary between disposal revenue of the firm and fiscal income of the state. In 1988, the government launched a new policy to separate tax from profit. An asset contract responsibility system was adopted in 1987 to share management power between SOEs and the state. But in 1991, the SOE performance remained unsatisfactory and uncompetitive.
In an effort to improve the weak performance of SOEs, a shareholding system was established for large SOEs, and the small SOEs were privatized during the third stage of the reform (1992–2002). Since 1992, the shareholding system was regarded as the best cure to avoid any ambiguities in property rights, which was considered the root of low competitiveness among SOEs. The third phase was successful in making small SOEs more viable. The share-holding system clarified the residual rights of SOEs. However, SOEs still suffered from the existence of multiple principals from various branches of the states. In the fourth stage (2003–present), the government established the State-owned Asset Commission at the provincial level, which serves to represent the states solely.
Since then, SOEs were able to concentrate on key industries, such as communications, energy, mining, and heavy equipment. The government pushed further price reforms to mitigate distortions in output and input factor markets. As a result, SOE performance improved considerably. From 2003 to 2006, the number of manufacturing SOEs was reduced from 3.61 thousand to 2.61 thousand, but their average annual profit growth rate reached 21.7%. Prior to this, their average sales annual growth rate was 20.2%. As shown in Figure 6, several key SEO financial indices, such as the gross profit to equities ratio, the total profit to assets ratio, the net profit to assets ratio, and the net profit to equities ratio, all increased dramatically in 1998. The recent performance of SOEs provides more evidence to interpret the surge of production and exports on machinery and transport equipment in the new century; as such activities are mainly performed by SOEs.
An interesting question arises: Why do SOEs become viable and have a better performance in the new century? There are at least three interpretations. First, the rapid accumulation of capital over time, expecially in the last three decades, changed China’s comparative advantages. Large-scale SOEs are more capital-intensive and are able to obtain more capital and natural resources from the state, which in turn put them in a favorable position in the market economy. Secondly, SOEs are still enjoying continous subsidies in the form of preferential access and repressed costs of finance and other inputs. Last but not least, many SOEs are concentrated in industries that are highly monopolized such as telecommunication. Accordingly, such SOEs are able to enjoy the monopoly rents in such sectors.
4.2 “DUAL-TRACK” PRICE REFORM ON OUTPUT AND INPUT FACTORS
Essentially, many large SOEs were not viable is because they were in sectors which defied China’s comparative advantages. The price distortions mentioned above were adopted to subsidize them. The dual-tract price reform was used as a way for the state to retain the ability to subsidize the nonviable SOEs. If the prices of output and input factors were suddenly determined by markets, all SOEs would collapse and shut down. Numerous workers would be laid off, and severe social unrest would follow.
To avoid such situation, China’s government adopted a dual-track price reform involving output and input factors. The government set the prices of goods within the state plan, whereas the market set those outside the state plan. In the initial reform period (1978–1984), market mechanisms were still not allowed to exist; the government merely adjusted various prices to narrow the gap between planned prices and equilibrium prices for each commodity. However, in 1985, market mechanisms were gradually introduced. As a result, the market outside the state plan grew tremendously, and the market price track rapidly increased. Before East Asia’s financial crisis in 1997, 81% of all commodity prices and 91.5% of retailed goods were set solely by the market (Lin et. al, 2004). Once output prices were primarily determined by the market, the pressure of price reform of input factors also emerged. In response to the strong demand in factor markets, China’s government also began to perform necessary reforms of exchange rates, wages and interest rates, as well as further pursuing its CAF strategyies. This section discusses the reforms in exchange rates and interest rates, leaving wage reform for the next section. In the heavy industry-oriented development strategy, the exchange rate is artificially set to a very low level. However, under the CAF development strategy, the exchange rate is ideally determined by the market so that the comparative advantage of industries can be correctly revealed. In turn, this revelation serves as a signal to guide governments in identifying and facilitating manufacturing sectors with comparative advantages.
As shown in Figure 7, the dual-track of the exchange rate reform in China underwent four phases. In the first phase (1978–1984), a triple exchange rate system was implemented. This system included the official rate, internal settlement rate, and swap rate, with the first two types of exchange as the most important during this period. The official rate was used externally for the exchange of both commodities and services. By contrast, the internal settlement rate, which was fixed at a constant level (i.e., RMB2.8 per dollar), was used to convert the earning foreign exchange inside China to RMB. China’s government gradually depreciated the official rate to converge it with the internal settlement rate. Hence, only a dual exchange rate system existed during the second phase (1985–1994): the official exchange rate represented the planned system, and the swap exchange rate represented the market system. At the beginning of the reform, China’s government facilitated a system of foreign exchange retention to encourage firms to export and earn foreign reserves. As a result, some firms were in a surplus of foreign exchange whereas others were in a shortage. The swap market was introduced for these trading firms to practice exchange. In this manner, the equilibrium swap rate indeed reflected the true cost of the RMB because it was determined by demand and supply. The market-based swap rate track grew gradually but firmly. By 1993, around 80% of foreign trade was settled by the swap rate (Lin et al., 2004). In the third phase (1994–2005), the dual exchange rates were merged into a single market exchange rate at RMB8.61 per dollar, which was fixed for the entire period. The last phase began in 2005, when China began to adopt a managed floating exchange rate. Within the next six years (2005-2011), China adjusted its exchange rate against US dollar from 8.27 yuan per dollar to 6.5 yuan per dollar, an appreciation of around 20%. Today, it is generally believed that China is approaching to its “equilibrium” exchange rate level, if any (Ma et al., 2012). Once again, the market-based exchange rate since 1994 serves as a milestone of the reform to allow manufacturing firms to reveal their true comparative advantage.
To make firms competitive in international markets, China had to mitigate the distortion in the factor markets, such as cost of capital. Only when the interest rates were set by the market could China’s government promote capital-saving technology and fully upgrade manufacturing structures. The first wave of China’s interest rate increase started in 1979, when the deposit and credit rates increased. The 1980s witnessed 10 occasions in which interest rates were raised. However, interest rates were reduced from 1990 to 1992 to stimulate the economy. After 1992, the government launched a new wave of interest rate increases primarily due to the emerging non-state financial markets, such as corporate stocks exchanged in Shanghai and Shenzhen. However, compared with the exchange rate reform, the reform of interest rates has been slow and gradual. Although the real interest rates maintain positive most times, they are not determined by demand and supply even today.Instead, interest rates are still used as an instrument to subsidize the large enterprises; most of them state owned. As such, the marketization of the interest rate is still ongoing.
4.3 INCREMENTAL REFORM IN THE VIABLE SECTORS
As mentioned above, two fundamental forces contribute to China’s successful structural reform and manufacturing upgrading. One is the adoption of the “dual-track” reform, and the other is the incremental reform in the non-state viable sectors. When the reform of SOEs was stagnant in the early 1980s, China’s government shifted gears to focus on the reform of the non-state economy. Such a policy is commonly referred to as an “incremental reform,” which is in accordance with China’s comparative advantage rooted in its factor endowments. The development of the TVEs serves as the best example to illustrate this incremental reform, which is helpful for understanding China’s industrial upgrading and structural transformation.
As illustrated by Lin et al. (2004), the following reasons explain the rapid expansion of TVEs in the 1980s. First, TVEs were able to exploit fully China’s comparative advantage in the rural area, that is, abundant labor, to facilitate their primitive factor accumulation. Compared with SOEs that mainly engaged in capital-intensive industries, most TVEs were involved in labor-intensive industries. A huge labor force was concentrated in the rural area as migration was strictly restricted in the 1980s. Accordingly, TVEs could obtain a cheap labor force and generate decent profits without relying on much capital. Second, TVEs could generate a stable revenue, as their products were popular in the market. The market had a severe shortage of light industrial products due to the implementation of heavy industry-oriented development strategies. The mainstream output of TVEs was labor intensive, and it could easily meet the market’s requirements. Finally, as opposed to SOEs that enjoyed government protection, TVEs faced a much tougher domestic competition market, causing them to exert the best moves to improve their productivity. Putting these three factors together, TVEs were able to remain viable, generate decent profits, and accumulate sufficient capital for future development.
Note that local governments played a significant role in facilitating the development of TVEs, especially in designing the mechanism of the profit sharing between TVEs and local governments. Unlike those of the SOEs, the managers of TVEs usually came from the grassroots, where there is generally limited room for promotion. As such, their main objective was to maximize the profits retained in the TVEs. As the managers of TVEs have the advantage of have more information about the firm’s operations, effective supervision was impossible for the local governments. To avoid such disadvantages caused by information asymmetry, local governments in the 1980s usually preferred the joint-stock cooperative system (i.e., hybrid firms owned by local government and enterprises of TVEs) to delineate the benefit between the government and the firms. This clear relationship on the residual claims fostered the TVEs’ rapid development. Since the 1990s, most of the TVEs became private firms and paid corporate taxes to the local governments instead.
China’s labor-intensive industries developed quickly in the late 1980s because of the rapid development of TVEs in rural areas. With both the capital accumulation in the TVEs and the gradual successful reform in SOEs, China was able to upgrade its manufacturing industr equipment.
4.4 “OPEN-DOOR” POLICIES AND REFORM
In addition to the domestic “dual-track” incremental reform, China’s rapid industrial upgrading and structural transformation were also attributed to its “open-door” policies. Before the reform, China was an inward and closed economy with a low openness ratio of 10% in the 1970s. However, as shown in Figure 8, the sum of China’s exports and imports today has increased to approximately two-thirds of its GDP. As mentioned previously, China has been the largest exporter in the world since 2009. The rapid growth of China’s exports is indeed the economic consequence of the implementation of the CAF strategy. On the one hand, China has produced many labor-intensive and capital-saving commodities in accordance with its comparative advantage of abundant labor; such products are attractive in the international market because of their low prices and decent quality. On the other hand, China’s domestic consumption market is relatively small, resulting in China exporting its products to clear the market (Lin, 2004; Yao and Yu, 2009). The huge exports generate desirable profits for firms and accumulate capital, which in turn upgrades China’s overall factor endowments. China can accordingly upgrade its manufacturing products in accordance with its changing factor endowments.

扫描下载手机客户端
地址:北京朝阳区太阳宫北街1号 邮编100028 电话:+86-10-84419655 传真:+86-10-84419658(电子地图)
版权所有©中国国际扶贫中心 未经许可不得复制 京ICP备2020039194号-2

