2014-The 8th ASEAN-China Forum on Social Development and Poverty Reduction3
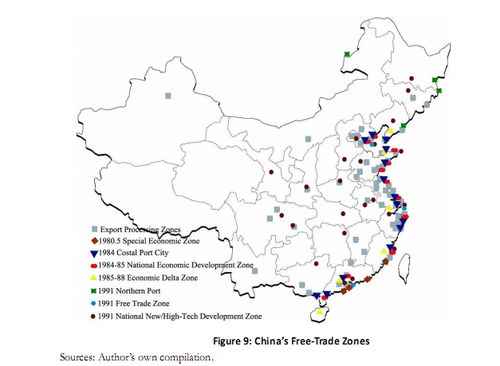
China’s open-door reform began from setting up various free-trade zones. This process can be summarized into three phases that started from points (i.e., some cities) to lines (i.e., eastern coastal zones) and then to an entire area (i.e., eastern and central provinces). In 1980, China selected four cities located in Guangdong and Fujian as special economic zones (SEZs). Essentially, the SEZs were used in export processing such that the imports of firms in the zones were duty-free so long as such imports were assembled for export. With the implementation of the “coastal development strategy” in 1984, China opened 14 coastal cities, as shown in Figure 9, and several national economic development zones and three economic delta zones were set up shortly after. In 1991, the government also opened four northern ports to trade with Russia and North Korea. At this point, most of the open cities were located in eastern China. However, in 1992, China decided to open more central cities in the form of national high-technology development zones.
In 1992, China began to liberalize its import tariffs and various non-tariff barriers. As reported by China’s customs administration, the simple average of China’s import tariffs declined from approximately 42% in 1992 to approximately 35% in 1994. Furthermore, to create favorable conditions to resume membership with the General Agreement on Tariffs and Trade (GATT)/WTO, China cut its import tariff from 35% in 1994 to 17% in 1997, a 50% phase-off in a three-year period. After China acceded to the WTO in 2001, it obeyed its commitment to reduce tariffs to around 10% in 2005. Although the effect of trade liberalization on economic development is still controversial (Krugman and Obsfeld, 2008), there is no doubt that it introduced tougher import competition for domestic firms including TVEs and SOEs. As opposed to low-efficiency SOEs that could still be in operation under various systems of government protection, TVEs with low efficiency would be swept out of the market. As a result, only the highly efficient and viable TVEs remained, which in turn made further manufacturing upgrading possible.
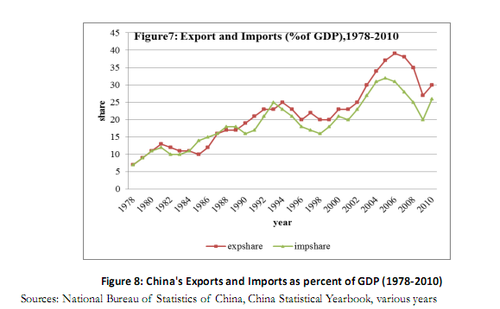
Another significant milestone of China’s open-door odyssey was the acceptance to the WTO in 2001. To gain WTO membership, China’s government had to mitigate much distortion in the output and input factors to adhere to the WTO’s requirements, which facilitated China’s economic transition and manufacturing upgrading (Lin, 2009). Moreover, the WTO accession also made China’s domestic reform irreversible, as China was required to obey the international trading rules set by the WTO (Lin et al., 2004). After China’s accession to the WTO, its foreign trade, including both imports and exports, rapidly increased. With a larger international market, Chinese firms were able to expand their production along with China’s dynamic comparative advantage, becoming a “world factory.” The last and perhaps the most important open-door policy is processing trade, which made China’s performance in foreign trade much better than that of India. As mentioned previously, the processing trade began in the early 1980s through processing with assembly and became prevalent in the 1990s through processing with purchased inputs. Most of the processing firms were foreign affiliates, of companies in Hong Kong, Macau, and Taiwan, and were concentrated in labor-intensive sectors in accordance with China’s comparative advantage. In 2000, one year before China’s accession to the WTO, the policy-makers decided to create export-processing zones (EPZs), whose number increased to 55 in 2010. The EPZs have the same free trade privilege as SEZs, but they also enjoy additional advantages such as sidestepping the entire complex administration and regulatory structure for processing firms within the zones. With such EPZs, China’s processing trade remained at around half of its total trade volume and provided more opportunity to adopt better technologies from abroad, which stimulated the country’s manufacturing upgrading.
5. EFFECT OF STRUCTURAL TRANSFORMATION ON EMPLOYMENT
AND POVERTY REDUCTION
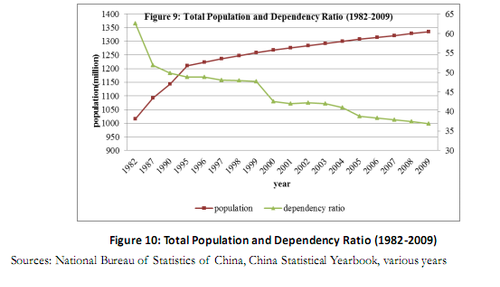
China is a labor-abundant country. As the largest country in the world in terms of population, it had approximately 962 million people in 1978, and this number increased to over 1.33 billion in 2009. China maintained a low and declining dependency ratio during its reform era and therefore enjoyed a sizable demographic dividend (Cai, 2010). As shown in Figure 10, the dependency ratio of China, defined as the ratio of people not part of the labor force to those within, was 62.6% in 1982 and 36.9% in 2009, which is one of the lowest dependency ratios in the world. China has a large labor force; at the end of 2009, the number of people employed was 798 million.60 This information can help us understand how China’s structural transformation and industrial upgrading can generate more employment and alleviate poverty. In the rest of this section, we will elaborate the employment change across sectors in the wake of China’s structural transition, followed by a careful scrutiny of employment movement within the manufacturing sectors caused by China’s industrial upgrading.
Finally, we will discuss how structural transition and industrial upgrading facilitate poverty reduction.
5.1 STRUCTURAL TRANSITION AND EMPLOYMENT CHANGE ACROSS
SECTORS
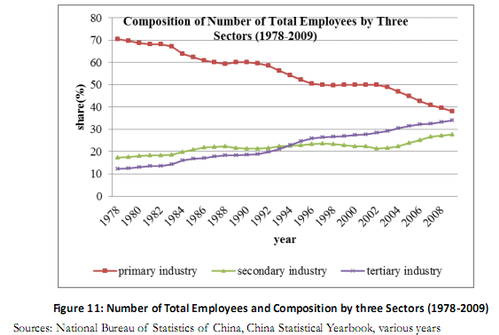
As previously discussed, before China’s economic reform, China remained an agrarian economy. It then adopted a heavy industry-oriented development strategy, which could only absorb a minimal number of workers, as heavy industries are capital intensive. These two forces resulted in a remarkably high proportion of labor in the primary industry. As seen in Figure 11, in 1978, around 70.5% of labor worked in the primary sectors: agriculture, forestry, fishery, and animal husbandry. In contrast, only 17.3% of labor was engaged in secondary industries, and the final 12.2% of labor were in tertiary industries.
Since its take-off, China has adopted a CAF development strategy. The country has then experienced a gradual structural transformation in the last three decades. As demonstrated previously, the GDP share of agriculture declined from 28.3% in 1978 to only 11% in 2009, and that of the tertiary industry increased from 23.9% in 1978 to 42% in 2010. The proportion of the secondary industry remained stable. The employment change by sector is positively associated with China’s structural formation. In 2009, the proportion of workers engaged in the primary sectors declined to 38.1%, a 50% reduction in proportion over a span of three decades, whereas that of tertiary industry increased to 34.1%, tripling in proportion after the reform. The proportion of employees in the secondary sector also increased to 27.8% in 2009, doubling in proportion during the period. The evolution of China’s structural change in employment exhibited four stages. In the first stage (1978–1991), the proportion of rural employment declined rapidly from 70% to approximately 60%; simultaneously, the proportions of secondary and tertiary industries increased quickly. The fast declining share in the primary sector was attributable to the implementation of the household responsibility system. When the People’s Commune system was aborted before the economic reform, much labor was liberalized from the land and transferred to the secondary and tertiary sectors in the urban areas. With the onset of the dual-track reform, SOEs gained more autonomy and more incentives to expand their production by hiring more permanent and temporary workers. Although hiring new permanent workers required state approval, managers of SOEs could still hire temporary workers who were initially farmers in the rural area. As such, labor increased in the SOEs. Similarly, the incremental reform in accordance with China’s comparative advantage resulted in the growth of TVEs in the 1980s. Millions of rural citizens left their lands to work in non-agricultural sectors.
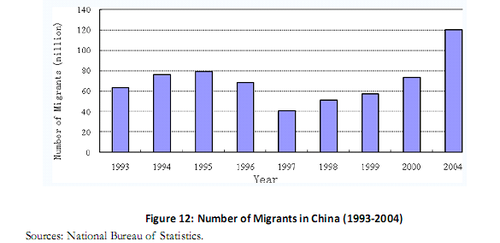
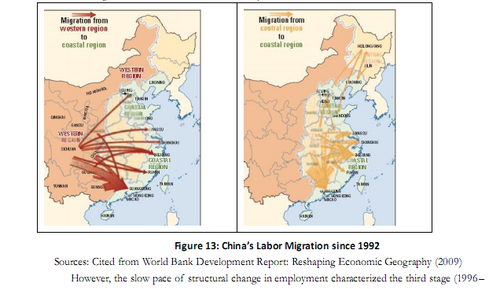
After a short stagnation of the structural change in employment during 1988–1991, China experienced its second stage of dramatic structural change from 1992 to 1996. In the early 1990s, China further alleviated the restrictions on migration from rural to urban areas. As shown in Figure 12, in the period of 1993–1996, more than 60 million laborers migrated from rural to urban areas to work in the secondary and tertiary industries. The migration routes were mainly from the western and central regions to coastal regions, as shown in Figure 13. At the end of this period, although half of the labor force was still engaged in the primary sector, the number of workers in the tertiary industries began to overtake that of the secondary industries.
However, the slow pace of structural change in employment characterized the third stage (1996– 2001). Two factors can explain this change. First, in 1997 and 1998, China faced an external negative demand shock. Owing to the East Asian financial crisis in 1997–1998, many East Asian countries depreciated their currency to stimulate their exports and overcome the crisis. However, China maintained a flat fixed rate for its currency, putting Chinese commodities in an unfavorable international competition environment. With such a negative demand shock, firms were unable to expand their production and hence could not absorb more migrants from the rural area. Second, more layoffs from SOEs provided more labor supply in the urban area. Since 1997, to overcome the inferior performance of SOEs, China’s government downsized and even privatized SOEs. This downsizing led to mass layoffs, which forced workers to find new job opportunities in urban areas. Weak demand and strong supply in the labor market left no room for rural migrants. Figure 12 shows that the number of migrants decreased from approximately 60 million in 1996 to approximately 40 million in 1997, a reduction of one-third .
The final stage of the structural change in employment took place after China’s accession to the WTO in 2001. Membership to the WTO granted China access to a larger international market, which provided better opportunities for China to implement its CAF strategy. As a result, the proportion of employment in the secondary industry increased from 21% in 2001 to 27.8% in 2009. Although 55% of the Chinese people still lived in rural areas, only 38.1% of them were engaged in the primary sector, contributing to 11% of the GDP. In this regard, the structural transformation resulted in China upgrading from an agrarian economy three decades ago to a “world factory” today. Equally important is the fact that the recent wage increases in the coastal provinces do not indicate that China has surpassed the “Lewis Turning point” and is no longer a labor-abundant country (Yao and Yu, 2009). With the improvement of agricultural productivity, more labor can still move from the primary sector to the secondary and tertiary industries.
5.2 INDUSTRIAL UPGRADING AND EMPLOYMENT CHANGES IN
MANUFACTURING
With its implementation of the CAF strategy, China upgraded its manufacturing structure from the coarse processing of petroleum and mining to the production of labor-intensive products, such as textile and apparel, in the 1980s. Using processing trade, China has upgraded its manufacturing structure from the traditional labor-intensive sector to capital-intensive sectors marked by the use of machinery and transport equipment since 1990s. Such manufacturing upgrading is also reflected in the employment changes in manufacturing sectors in the last three decades. The change in proportion of manufacturing employment to the entire employment in the secondary industries over time must be verified to examine the evolution of employment change in manufacturing. In 1982, when the economic reform was just launched, manufacturing workers accounted for around 71% of labor in the secondary industry. The proportion was reduced to only around 50% in 2009, indicating that more workers move toward industries such as construction partly because of the labor-saving improvement in technology.
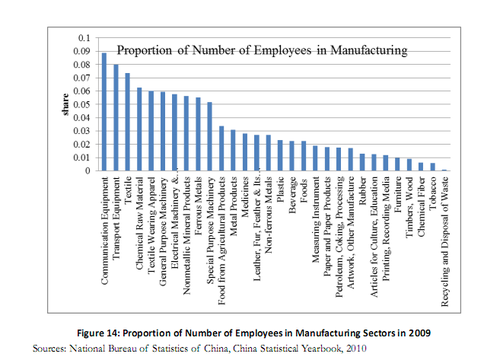
More importantly, in 2009, the manufacturing sector that had the largest number of employment was no longer textile or apparel (Figure 14), although such transitional labor-intensive industries still had a large pool of employment. The sector with the largest employment was manufacturing of communication equipment (9% of all manufacturing employment) followed by that of transport equipment (8% of all manufacturing employment). Again, this finding suggests that the employment structure within the manufacturing sectors movse along with industrial advances.
5.3 STRUCTURAL TRANSFORMATION AND POVERTY REDUCTION
Before the economic reform, the living standards of people improved little with the implementation of the comparative-advantage-defying development strategy. The development of heavy industries was top priority. Almost all limited materials were allotted for heavy industries. Therefore, the economy did not have required materials to develop light industries and improve the living standard of people. The profit generated by the heavy industries was not used for consumption but for further capital accumulation. The government also set low and fixed wages in the urban area. In the rural area, peasants suffered from the unfavorable terms of trade of agricultural products relative to industrial commodities. Moreover, side-production, such as fishery and animal husbandry, was strictly prohibited in the countryside. Hence, the improvement of the living standard in the rural area was hardly possible. Given that China was an extremely poor and agrarian economy before its political independence, the heavy industry-oriented development strategy made the improvement of the living standard in the rural area hardly possible. As a result, almost 30% of people lived below the poverty line, which is equal to RMB627 (equivalent to around US$100 at the current exchange rate) per person per year.
China has adopted a CAF development strategy since its take-off based on its factor endowment. The structural transformation in the last three decades has led to a tremendously successful poverty reduction. According to the estimates of Chen and Ravaillon (2008), the poverty rate in China was 41.6 percent in 1980, but it declines to 15.9 percent in 2004. The per capita annual net income of rural households also increased from RMB133.6 in 1978 to RMB3587 in 2006, a 20-time increase within three decades.
Several reasons can be attributed to the great success of the poverty reduction in China since its economic reform. First, as the first step of economic reform, the government of China changed the People’s Commune to the household responsibility system to stimulate the initiatives of farmers. The distortion price policies set to support the heavy industry-oriented development strategy were gradually corrected. The price scissors of agricultural products against peasants were abolished. Accordingly, the terms of trade of agriculture improved rapidly, which was very helpful in improving the income of peasants. Second, lands were reallocated to farmers, who were also given full autonomy of production. Hence, the production incentives improved dramatically. Third, in the new century, the Chinese government also abolished the agricultural tax that had existed for more than 2000 years. As a result, the disposable income for peasants increased.
Perhaps the most important reason for the improvement of the living standard in the rural area is the dynamic growth of the TVEs in line with the structural transition in China. As previously analyzed, TVEs provided huge employment opportunities for people who lived in rural areas. Compared to working in the primary sector, obtaining a job in the TVEs generally secured a higher income. The TVEs were located in the rural area where extreme poverty was usually present (Naughton, 2005), and the growth of TVEs significantly contributed to poverty reduction.
In addition, the increasing share of service industries also plays an important role in alleviating poverty. As shown in Figure 2 before, the GDP share of service industry increased from 25% in the late 1970s to around 42% today. As service sectors like restaurants are very labor-intensive, they are able to absorb huge numbers of labor migrants from rural China. The increase in employment in services is more prominent than that in the secondary industry. In particular, today the employment ratio in service industry increased from 12.2% in 1978 to around 33% today. By contrast, the employment ratio in secondary industry only increased from 17.3% in 1978 to around 27% today. Finally, support and facilitation from the government also played a significant role in the alleviation of poverty. In 1992, the Chinese government began to identify the designated poor counties around the country, followed by a generous anti-poverty funding to facilitate the development in such areas. In 2002, the Chinese government also created a western development program and emphasized the special role of development in the western and interior regions. With an expanded infrastructure investment and a fast increase in fiscal supports, poverty in rural areas was greatly alleviated.
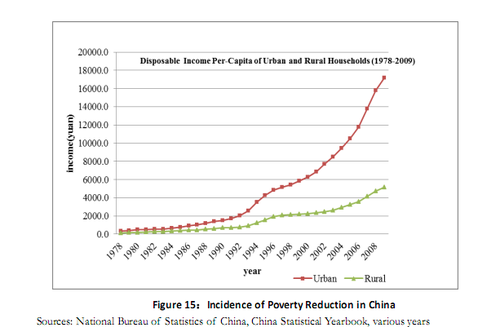
The income of urban people also increased dramatically during the economic reform. As shown in Figure 15, the per capita annual disposal income of urban households increased from RMB343.4 in 1978 to RMB11, 759.5 in 2006 (measured in nominal prices), a more than 30-time increase. The improvement of the living standard in the urban area was mainly attributable to the success of SOE reform and the booming of private sectors. In the late 1990s, when the SOE reform was in a stagnant situation, the government decided to downsize large-scale SOEs by allowing firms to lay off their workers and encouraging workers to avail of an early retirement. The new ministry of labor and social security was established in 1998 to facilitate laid-offs to find new jobs. The government also created a new agency called the Re-employment Center, which allowed laid-offs affiliation for a maximum of three years. Small SOEs were allowed to switch to private. Given such effort, three-quarters of the laid-offs found new jobs in the new century. The rest instead worked in urban or private sectors, or retired earlier. The government also granted fiscal support to pay for the huge amount of pensions to compensate for the early-retired workers. As a result, China obtained a low unemployment rate in the rural area in the new century.
6. LESSONS TO BE LEARNED FROM CHINA
The Chinese economy has been transformed from a central-planned agrarian economy to the largest world factory, in which the market plays a dominant role in resource allocation. With an average annual growth rate of 9.9 % during three decades, China has been the most important locomotive of the world economy. With its successful structural transformation and manufacturing upgrading, China has changed from a backward and closed economy to a forward and open economy. The remarkable success of the economic reform in China is also very effective in the alleviation of poverty and improvement of the living standard of the people in both rural and urban areas. Two main lessons can be drawn from the successful experience of the economic reform in China. First, a developing country should promote economic growth by adopting a CAF development strategy based on its factor endowments. Before the economic reform, China adopted a strategy that defied its latent comparative advantage of abundant labor. By wrongly granting top development priority to heavy industries, a set of micro-institution arrangements and macro-economic policies were chosen, and prices of input factors and outputs were distorted to accompany such a CAD development strategy. As a result, firms were non-viable in a competitive market. In contrast, after following its comparative advantage driven by its factor endowments, labor-intensive industries were encouraged, and distorted factor prices were mitigated. Firms were granted sufficient autonomy, and profits were shared to stimulate the Chinese initiative. Hence, industries with comparative advantages were able to compete in the market, generating higher profit margins. Hence, China was able to accumulate capital and move up the industrial ladder to develop more capital-intensive industries step by step.
Secondly and equally important, the governments of developing countries should identify and facilitate the development of new industries consistent with their respective latent comparative advantages. The sole objective of firms in any industry is to maximize profit. The firms are unaware or do not have much concern about the factor endowments in their economy. They will follow the latent comparative advantage of the country if and only if the factor prices truly reflect the abundance of factors in the economy (Lin, 2009). Relative factor prices can only be created through the market mechanism. Hence, the primary task of the government is to remove all distortions in the factor market and create a fair and competitive market.
However, governments cannot simply create a laissez-faire and free market. They still need to play a proactive role to identify and facilitate structural formation and industrial upgrading for the following reasons (Lin, 2012). First, information for an industrial upgrading requires specific investment. With the dynamic evolution of comparative advantage in the economy, a single firm is not financially equipped to collect sufficient information to determine which industries along the global manufacturing frontiers are associated with the latent comparative advantage of the country. Such information is the property of public goods, as the collection of the information is costly, but the marginal cost to share such firms is nil. The government should collect and analyze such information to avoid the unnecessary repetition of investing on such information.
Second, structural transformation and manufacturing upgrading require coordination between firms in different sectors. For instance, a firm in an industry may not be able to internalize the supply of a variety of factor inputs, such as skilled labor and industry-specific technology. In addition, the success of the manufacturing upgrading of a firm also needs a matured and well-functioning system of soft infrastructure, such as financial institutions and market distribution facilities. Such requirements can hardly be provided by a specific firm. Instead, the government can play a non-substitutable role to provide coordination among firms in different industries.
Finally, technological innovation is essential for structural transformation and manufacturing upgrading but is a very risky and costly input. The first-mover firms have to pay huge R&D costs for the new product or a better-processed technology, but they bear the high probability of failure. With the positive externalities, other firms will follow and share the extra economic profit. If the benefits of firms were not protected for a reasonable timespan, few firms would have the incentive to invest on innovation. Accordingly, the structural transformation and manufacturing upgrading would cease. Unlike in the matured patent system in developed countries, the first-mover firms lacking the appropriate patent would locate in a matured market along with the global industrial frontier. As compensation, the government should give the necessary support to such first-mover firms. In this regard, government adjustment and guidance are necessary ingredients of structural transformation and manufacturing upgrading. China does provide an excellent example to shed light on this idea. The next natural question is how the government in a developing country can identify appropriate growth oppotunities and how it can facilitate structural transformation and manufacturing upgrading. Lin (2012) suggests a framework with six simple steps.
First, a developing country should choose a reference, a successful country that has a similar factor endowment but with about 100 percent higher per-capita income than its own. For example, China could be a desirable example for Vietnam and India, as both are labor abundant while the per capita GDP of China is more than twice as high as that of Vietnam and India.
Second, by identifying the top 10 tradable goods in China, as shown in Table 2, the government in a country like India can prioritize development in industries the domestic firms have already entered. In particular, a set of policies should be implemented to remove the barriers or mitigate the distortion that prevents such domestic firms from upgrading the value-chain of products or realizing its viabilities. A good example is China adopting various policies to encourage the development of TVEs in the 1980s. Of course, if any industry is not included in the reference group but nevertheless turns out to be competitive and viable, the government should also facilitate and provide the necessary industrial policies for such firms.
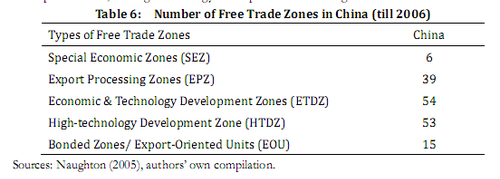
Third, if no domestic firms exist in some referenced industries, foreign direct investment (FDI) should be encouraged. Firms can learn from the positive technology spillovers from such inward FDI. The inward FDI of China accounted for 6% of its GDP in the early 1990s, and it maintained at a plateau of 3% of GDP afterwards. The surge of the inward FDI in the 1980s brought new technology, clearly facilitating the manufacturing upgrading of China from the standard labor-intensive industries to more capital-intensive and even technology-intensive industries. Fourth, if a country is associated with an unfavorable business and infrastructure environment because of the adoption of the comparative-advantage-defying strategy, the government in such country may adopt the dual-track reform like China. In particular, the establishment of various export processing and industrial zones is helpful to encourage industrial clustering, given that a desirable infrastructure investment cannot be constructed in the whole country because of limited resources and low income. As shown in Table 7, China established more than 160 EPZs, economic development zones, and high-technology development zones during its economic reform.61
Finally, the government should provide incentives to encourage first-mover firms. Such polices may include short-run income tax exemption, direct credit, and access to foreign reserve. For example, to attract more inward FDI, the Chinese government adopted a two-year income tax exemption for foreign firms. Such a policy was also much more rational (??) than the standard requirement of “national treatment” set by the GATT/WTO. Thus, a country should update its industrial structure in accordance with its latent comparative advantage driven by its factor endowment. Governments of developing countries should play a proactive role to overcome the externality, information asymmetry, and failure of coordination.
7. CONCLUSIONS AND POLICY SUGGESTIONS
In this chapter we first present evidence that China has become successful in its structural transformation and industrial upgrading since its economic reform in 1978. The reason why China’s economy was not competitive before the reform structure is the wrong implementation of the heavy industry-oriented development strategy, which is essentially a comparative-advantage-defying development strategy. The industrial structure before the reform was more advanced but less competitive due to defying China’s comparative advantages. In sharp contrast, the China government 61 Studies like Dai and Yu (2012) find the strong positive effect of learning from exporting for Chinese exporting firms that located in export processing zones. switched to a CAF development strategy after the reform. Two main sets of policies can interpret the tremendous success of China’s economic reform. The adoption of the “dual-track” reform provided temporary protection to the old capital-intensive industries. Such gradual reform was Pareto-optimal and easy to implement. The China government played a proactive role in providing industrial identification and structural upgrade facilitation. The successful structural transformation and manufacturing upgrading also created many new working opportunities for both urban and rural workers. As a result, poverty in China was greatly reduced. China also developed from a least-developed country to a higher middle-income country within three decades and hence created a miracle of economic growth in the history of mankind. The successful case of structural transformation and manufacturing upgrading in China also provides rich implications and helpful means for developing countries to develop their economies.
Finally, similar to reform in other developing countries, reform in China is still ongoing and incomplete. For example, the distortions in the factor markets have become a significant hurdle for sustainable growth in China (Hsieh and Klenow, 2009). Hence, the remaining distortions in the financial structure, resource levies, and monopoly in the service sector, which are the legacies of the dual-track reform, should also be subject to reform.
References
Amsden Alice (1989), Asia's Next Giant: South Korea and Late Industrialization, Oxford University
Press.
Brandt, Loren, Johannes Van Biesebroeck, and Yifan Zhang (2012), "Creative Accounting or Creative
Destruction? Firm-Level Productivity Growth in Chinese Manufacturing," Journal of Development
Economics 97, pp. 339-331.
Cai, Fang (2010), “Demographic Transition, Demographic Dividend and Lewis Turning Point in
China,” China Economic Journal 3(2), pp. 107-119.
Chen Shaohua and Martin Ravallion (2008), "The Developing World is Poorer Than We Thought, But
No Less Successful in the Fight against Poverty," Policy Research Working Paper No. 4703.
Dai Mi and Miaojie Yu (2012),"Firm R&D, Absorptive Capacity, and Learning by Exporting:
Firm-Level Evidence from China" , The World Economy, forthcoming.
Feenstra, Robert, Hong Ma, J. Peter Neary, D.S. PrasadaRao (2011), “How Big is China? And Other
Puzzles in the Measurement of Real GDP,” mimeo, University of California, Davis.
Feenstra, Robert, Zhiyuan Li, and Miaojie Yu (2011), “Exports and Credit Constraints Under
Incomplete Information: Theory and Evidence from China,” NBER Working Paper, No. 16940.
Gaunaut, Ross (2010), “Macroeconomic Implications of the Turning Point,” China Economic Journal,
3(2), pp. 181-190.
Hsieh, Chang-Tai and Peter J. Klenow (2009), "Misallocation and Manufacturing TFP in China and
India," Quarterly Journal of Economics, 124(4), pp. 1403-48.
Lin, Justin, Yifu (1990), “Collectivization and China’s Agricultural Crisis in 1959-1961,” Journal of
Political Economy, 98(6), pp. 1228-52.
Lin, Justin, Yifu (2003), “Development Strategy, Viability and Economic Convergence.”Economic
Development and Cultural Change 53 (2): 277–308.
Lin, Justin, Yifu, Fang Cai, Zhou Li (2004), The China Miracle: Development Strategy and Economic
Reform, The Chinese University of Hong Kong.
Lin, Justin, Yifu (2009),Economic Development and Transition: Thought, Strategy, and Viability.
Cambridge: Cambridge University Press.
Lin, Justin, Yifu (2010), “The China Miracle Demystified,” Econometrica, forthcoming.
Lin, Justin, Yifu (2011), “New Structural Economics: A Framework for Rethinking Development.”
World Bank Economic Observer 26(2), pp. 193-221.
Lin, Justin, Yifu and Celestin Monga (2011), “Growth Identification and Facilitation: The Role of the
State in the Dynamics of Structural Change,” Development Policy Review 29(3), pp. 254-290.
Lin, Justin Yifu (2012), Demystifying the Chinese Economy, Cambridge University Press.
Lin, Justin Yifu (2012), New structural Economics, The World Bank, Washington D.C.
Krugman, Paul (1979), “Increasing Returns, Monopolistic Competition, and International Trade,”
Journal of International Economics 9, pp. 469-479.
Krugman, Paul and Maurice Obsfeld (2008), International Economics: Theory and Policy, 7th edition,
Pearson and Addison Welsey.
Ma, Guonan, Robert McCauley and Lillie Lam (2012), “Narrowing China’s Current Account Surplus,”
in Huw McMay and Ligang Song (eds.) Rebalancing and Sustaining Growth in China, Australian
National University E-press, pp. 65-93.
Naughton, Barry (2005), The Chinese Economy: Transitions and Growth, The MIT Press.
Ravallion, Martin and Shaohua Chen (2004), “China’s (uneven) Progress Against Poverty,” World
Bank Policy Research Working Paper, No. 3408.
Rodrik, Dani (2008), ““What’s so Special about China’s exports?” China & World Economy 14(5), pp.
1-19.
Yu, Miaojie (2011a), “Moving Up the Value Chain in Manufacturing for China,” mimeo, CCER,
Peking University, Available at SSRN: http://ssrn.com/abstract=1792582.
Yu, Miaojie (2011b), “Processing Trade, Tarff Reductions, and Firm Productivity: Evidence from
Chinese Products,” mimeo, CCER, Peking University. Available at SSRN:
http://ssrn.com/abstract=1734720 .
Yu, Miaojie and Wei Tian (2012), “China’s Processing Trade: A Firm-Level Analysis,” in Huw McMay
and Ligang Song (eds.) Rebalancing and Sustaining Growth in China, Australian National University
E-press, pp. 111-148.
CHAPTER 5 PRIMARY ANALYSIS OF THE DIRECT SUBSIDY
POLICIES TO FARMERS IN CHINA AND ITS INPUT LEVEL62
Wanlong Lin Yu Ru
College of Economics & Management, China Agricultural University,
Beijing
[Abstract] Chinese government has started to carry out the direct subsidy policies to farmers since
2001, which plays an important role in solving the “agriculture, rural villages, and farmers” issues.
This paper summarizes the direct subsidy policies system developed from 2001 and analyses the effect
of the direct subsidy policies on farmers’ income. It is concluded that the scope and the fiscal support
scale of direct subsidy policies to farmers by the central finance are both increasing, and the policy is
also beneficial in improving the income level and narrowing the income gap between urban and rural
areas. However, reimbursement subsidies, which mean the subsidy couples with farmer’s expenditure,
occupies the main percentage of total subsidy input and appears higher and higher proportion, it
makes richer people obtain more benefits than poorer people and has negative pro-poor effect. More
attention needs to be paid in evaluating the policy effect on the poor, and more specific and
farm-friendly policies should be made in future to make up the negative effect.
[Key words]Direct subsidy policies to farmers, Pro-poor
1. INTRODUCTION
Since the new century, according to the claim of “urban and rural economic and social integration development”, the Chinese government has focused on addressing sannong issues and increased significantly in the financial input of rural public utilities. The policy have already had a positive impact on improving farmers’ welfare level and narrowing the gap between urban and rural areas.
Direct subsidy policies to farmers are important policies in sannong development strategy. For the 62 The periodical research achievement of the national social science fund project “rural public goods supply mechanism and policy research in the urban-rural integration process” (Project number: 10BJY059). The authors would thank master student Xiaoxue Wang, from the College of Economics & Management of China Agricultural University, for her help of collecting data. central finance, the policy has begun since 2001. Prior to 2001, the Chinese government implemented less programs and money for farmers, which were mainly indirect subsidies63. In 2001, the Chinese government launched the “two exemptions and one subsidy” (TEOS) program, aimed at reducing the out-of-pocket costs of compulsory education for rural children. Then, the agricultural direct subsidy policy, the agricultural insurance subsidy policy, the new rural cooperative medical care subsidy policy and so on have been introduced in succession. The direct subsidy policies gradually expanded its scope and scale. It was examined that central finance input for direct subsidies to farm households grew from RMB 12.4 billion in 2003 to RMB 391.29 billion in 2012, and from RMB 13.2 to RMB 409.38 per participant during that time. The implement of the rural tax-for-fee reform and direct subsidy policies to farmers has essentially changed the “give-take” relationship between the state and farmers.
There are a large number of researches on assessing specific subsidy policies. Some were concerned about agricultural direct subsidy policy’s assessment (Gao and Zhao, 2014; Cheng and Zhang, 2012; Huang et al., 2011; Liu, 2010; Cao et al., 2010; Li and Wan, 2010; Jiang and Wu, 2009; Zhou et al., 2009); Some were related to the assessments of compulsory education “two exemptions and one subsidy” policy, new rural cooperative medical care policy, new rural social pension insurance policy, purchase of household electric appliances subsidy policy, household biogas subsidy policy and land transfer subsidy policy(Cheng and Zhang, 2012; Qiu et al., 2013; Zheng et al., 2012; Lin and Cao, 2012; Li and Shi, 2011; Huang, 2011; Ma et al., 2011; Liu, 2011; Feng et al., 2011; Qin and Zheng, 2011; Xu and Lv, 2010; Wang, 2009; Wu, 2011). However, considering that the direct subsidy policies to farmers involve complex programs and many implementation agencies, there is no holistic analysis of policy system and input scale by far. Lin and Wong(2012) tried to research on it. In this paper, a further research was conducted on this topic. Nevertheless, our research was very primary.
As the general definition, direct subsidies to farmers mean that the country or the government take direct transfer payment to farmers to improve farmers’ income, including direct income subsidies, and indirect security and relief and so on from fiscal support (Yuan et al., 2008; Chen, 2005). In this paper, direct subsidy policies to farmers are defined as the direct fiscal subsidy policies that mainly benefit specific families, including direct cash subsidies, and those reduced and exempted or partially reimbursed expenditures. The definition is broader than general ones, but more comprehensively reflects the actual support scale of the government “giving” to farmers. It should be noted that, due to the restriction of data, the direct subsidy policies to farmers in this paper represents the central government’s policies, without regional government’s policies.
2. THE ESTABLISHMENT OF CHINESE DIRECT SUBSIDY POLICIES
SYSTEM TO FARMERS AFTER 2001
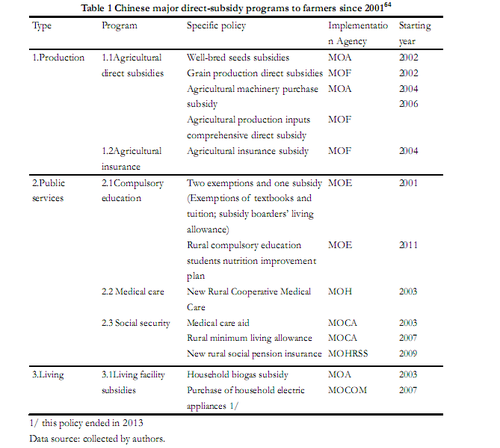
Chinese direct subsidy policies system to farmers established mainly in the past ten years after 2001. Table 1 presents that major direct-subsidy programs financed by the central finance and their starting year. It can be observed that direct subsidy policies to farmers in China are a kind of complicated policy system, large range and broad involving, including not only production-oriented subsidy such as agricultural direct subsidy, but also subsidy to public services such as medical care, 63 For example, as an important subsidies policy, prior to 2001, the subsidies for grain production previously went to state-owned grain trading enterprises to offset their trading losses from subsidizing procurement, which is a typical indirect subsidy. compulsory education and poverty reduction. Furthermore, subsidy has been extended to the field of daily life of farmers such as subsidy to the purchase of household electric appliances. It is revealed that Chinese government has shifted its focus on sannong issues from infrastructure construction to personal welfare issues, and from “agriculture” issues and “rural villages” issues to “farmers” issues.
3. FARMERS DIRECT SUBSIDIES SCAL
3.1 INPUT SCALE
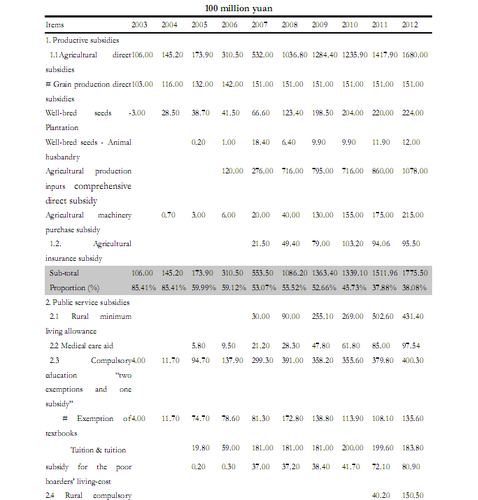
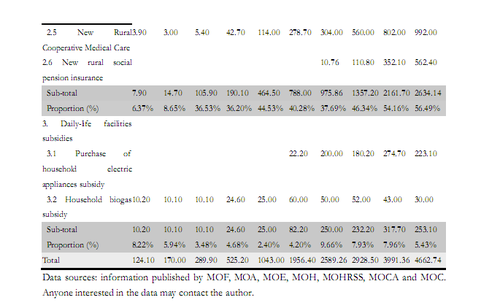
In China, it is not easy to obtain the statistical information on the scale of the government’s input into the farmers direct subsidy policies, which was mentioned above. Chinese government has never published a centralized and specialized report on the scales of all kinds of subsides. The scales of central finance subsidies were dispersed in the published reports and information from the competent ministries. As shown in Table 2, we spent large amount of time and energy in collecting 64Table 1 may not contain all direct-subsidy programs to farmers since 2001, but presents major policies. the statistical information on the input scales of the central finance direct subsidies to farmers, from the websites of ministries including Ministry of Finance, Ministry of Agriculture, Ministry of Education, Ministry of Health, Ministry of Human Resources and Social Security, Ministry of Civil Affairs and Ministry of Commerce. This kind of systematic statistics have never been found on the available literatures.
Anyone interested in the data may contact the author.
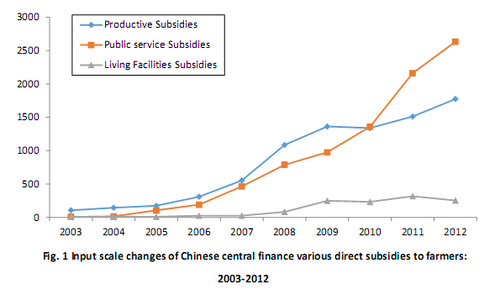
According to the data in Table 2, during 2003 to 2012, Chinese central finance direct subsidies to farmers increased 36.3 times (in nominal price terms), and the annual increase rate could be 49.5%. Hence, it can be seen that Chinese government was rapidly increasing its subsidies to farmers, starting from 2007. Classified by the usage, production subsidies were the main ones in 2003; public service subsidies began to increase considerably after 2005; public service subsidies have exceeded production subsidies after 2010. The development trend is presented in Fig. 1.
3.2 PROPORTION IN CENTRAL FINANCE EXPENDITURES ON SANNONG
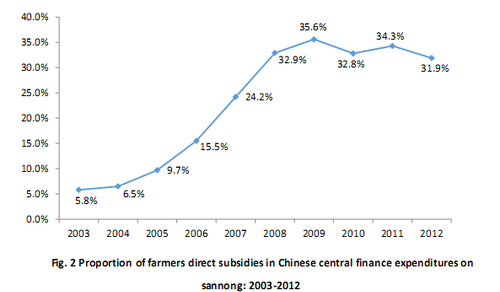
According to the statistical caliber, direct subsidies to farmers belong to one of the government expenditures on sannong. In 2003, farmers direct subsidies accounted for 5.8% of the central finance expenditures on sannong. In 2012, the proportion increased to 31.9%, as shown in Fig. 2. Therefore, direct subsidies to farmers have become an important means of Chinese central finance support for farmers.
4. DIRECT CONTRIBUTION OF DIRECT SUBSIDY POLICIES TO
FARMERS ON FARMERS’ INCOM
The implement and increasing coverage of the direct subsidy policies to farmers indicated that Chinese government took a shift toward paying attention to welfare improvements in sannong issues, rather than only infrastructure construction, and caring more about “farmers” issues than “agriculture” and “rural villages” issues. Undoubtedly, from the overall, various direct subsidy programs to farmers contributed to increasing farmers' disposable income level through increasing directly subsidy incomes or decreasing household expenditures.
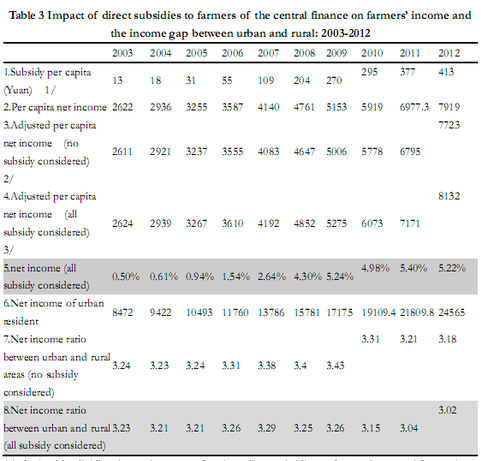
In a dynamic process, direct subsidies to farmers can affect farm households’ incomes by the direct or indirect ways. For example, in the research of new rural cooperative medical care system, Qi (2011) found that the policy raised income level by decreasing the direct medical expenses, and on the other hand, it could help to improve farmers’ health by enhancing the access to medical care, thus enforced labor supply and labor efficiency and then promoted farmers to get higher incomes. As subsidies have complex indirect influence mechanism on incomes, this paper only analyzed the direct effect here. It is shown in table 3 that direct subsidies’ contribution ratio on the farmers’ actual incomes 65 65 According to Chinese statistics caliber, Per capita net income of rural resident is production net income, and it equals total income(including partial government subsidies, shown in remark 2 of table 3) minus production by central finance grew from 0.50% in 2003 to 5.22% in 2012. However, many factors led to that the income gap between urban and rural areas continued to widen, direct subsidy programs were not enough to settle the problem: Net income ratio between urban and rural areas narrowed from 3.24 in 2003 to 3.18 in 2012 without subsidies considered, while the ratio narrowed from 3.23 in 2003 to 3.02 in 2012 with subsidies considered. The income gap has been narrowed slightly with subsidies.
1/ obtained by dividing the total amount of various direct subsidies to farmers by central finance in Table 2 by the agricultural census register population in the same year.
2/ according to Chinese statistics caliber, the grain production direct subsidies, well-bred seeds subsidies, agricultural production inputs comprehensive direct subsidy and rural minimum living allowance subsidy in Table 2 belong to part of “per capita net income of rural resident” statistically. Therefore, per capita net income of rural resident without subsidies considered was supposed to equal unadjusted (that is gotten as the statistical caliber) per capita net income of rural resident minus subsidy per capita above.
3/ equals adjusted per capita net income (no subsidy considered) adds subsidy per capita. expenditure. Therefore, the subsidies in the form of reduced and exempted or partially reimbursed consumer spending(including mainly public services and living facilities spending) are not the statistical component of per capita net income of rural resident, but they have enhanced farm households’ actual income level indeed.
Data sources:calculated by relevant data, where per capita net income of both urban and rural were from “disposable income per capita of urban resident” and “per capita net income of rural resident” in the China statistical yearbook of calendar year.
5. PRIMARY EVALUATION OF PRO-POOR OF SUBSIDY MECHANISM
Seeing from the researches and practices all over the world, poor families tend to be the underprivileged beneficiaries of the government public expenditures. World development report (2004) from World Bank indicated that in the absence of a reasonable system design and the necessary supports, it was often difficult for the poor people to benefit from the government public services. According to the calculation (Gupta, 1977), the poor people in India could benefit from less than 1/6 of Indian central finance expenditures during 1973 ~ 1974. In India, the richest people, who are account for 20% in the national population, owned three times government medical care services than the poorest people, who are account for 20% in the national population (Peters, Yazbeck, R., Ramana, Lant and Wagstaff, 2002). In Nepal, 46% of the government education expenditures were acquired by the richest people, 1/5 of the national population, but the poorest people only obtained 11% of the government education expenditures (Devarajan and Shah, 2004).
Even in the supporting programs aimed at the poor group, a major challenge is that poverty reduction funds are captured by non-poor group. People who are not in poverty often can use their economic advantage to acquire welfare service policy for their own (Jha, Bhattacharyya, Gaiha and Shankar, 2009). Park and Wang (Park and Wang, 2010) used matching method based on villages and households’ panel data to do a research, and the result showed that during 2001~2004, Chinese special anti-poverty policy significantly increased the input for poverty reduction on both levels of the governments and villages, but it could not increase the incomes or consumptions of the poor farm households, and richer farm households’ incomes and consumptions increased 6.1% ~ 9.2%. Chinese State Council Poverty Alleviation Office(2010) revealed in the investigation report, there are indeed pro-poor insufficiency problem and disadvantaged group protection insufficiency problem in the distribution of direct subsidy funds such as grain production direct subsidies.
Undoubtedly, in general, the implementation of various farmers direct subsidy policies help to increase farmers’ disposable income by directly increasing subsidy incomes or reducing household expenditures. If the whole farmers are regarded as a relatively poor group, direct subsidies to farmers benefit the poor undoubtedly. However, in this group, who can acquire more benefits from the subsidies policy should be seriously considered. It is related to the social equity of policy implementation and policy outcomes. Generally speaking, what we are concerned about is that due to mechanism defects in subsidy policies, most farmer direct subsidies are more likely to be acquired by richer farmers.
At present in China, there are various farmer direct subsidy polices by central finance, with different policy objectives. They can be classified into three categories from the point of subsidy mechanism. Universal benefit subsidies Such kind of subsidies benefits all of the farmers: they do not need to increase extra spending for acquiring their subsidies. Agricultural production inputs comprehensive direct subsidy is the most typical universal benefit subsidy: famers can obtain subsidies as long as they have arable lands, while almost all famers have arable lands. Grain production direct subsidies and compulsory education exemptions on schoolbooks’ expenses and incidental expenses after 2007 are also categorized into this kind of subsidies.
Expenditure coupled subsidies
Such kind of subsidies couples with the farmers specific expenditures, in the form of reimbursement, but they can only make up part of specific expenditures. Agricultural machinery purchase subsidy, purchase of household electric appliances subsidy, household biogas instruction subsidy, well-bred seeds subsidies, and agricultural insurance subsidy all belong to this kind of subsidies. Financial subsidy in new rural cooperative medical care is based on population by a certain standard, but all subsidy funds are put into new rural cooperative medical care funds. Only those with qualified medical charges can get the subsidies. Sick farmers must pay for part of the medical fees themselves. Thus, new rural cooperative medical care subsidy also belongs to expenditure coupled subsidy.
Poverty targeting subsidies
Such kind of subsidies is distributed to poverty population, only those match specific standards can get this kind of subsidies. For example, rural minimum living allowance subsidy is only available for rural minimum living allowance residents, and medical care aid subsidy and subsidy for the poor boarders’ living-cost are only available for rural poor families. Besides, compulsory education exemptions on schoolbooks’ expenses and incidental expenses before 2007 also belong to this kind subsidy.
Income redistribution functions of the three types of subsidies are different. As to the mechanism and direction, universal benefit subsidy can increase farmers’ income and reduce the incidence of absolute poverty, but it had a neutral effect on narrowing the farmers’ income gap and alleviating the relative poorness; expenditure coupled subsidy can enlarge the farmers’ income gap inside the countryside and it is bad for alleviating the relative poorness, because only those with supporting funds can obtain expenditure coupled subsidy, which is more unfair for poor families (low income families and absolute poor families); poverty targeting subsidy is the only type of subsidy which can help to alleviate both absolute and relative poorness.
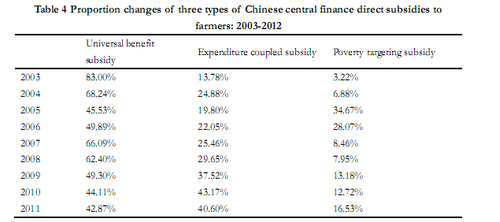
The present condition in China is that, for the three types of subsidies, poverty targeting subsidy has the smallest proportion. An obvious trend shows that since 2003 when the government greatly increased the implementation of subsidy policies, the proportion of expenditure coupled subsidy has been rapidly increasing and the proportion of universal benefit subsidy has been significantly decreasing. (Table 4)
Comments: 1. According to the definition of three types of subsidies in this paper, universal benefit subsidy was calculated in this table, including grain production direct subsidies, agricultural production inputs comprehensive direct subsidy, exemptions on schoolbooks’ expenses and incidental expenses after 2007, rural compulsory education students nutrition improvement plan after 2011, and new rural social pension insurance after 2009 in Table 2; expenditure coupled subsidy includes well-bred seeds subsidies of plantation and animal husbandry, agricultural machinery purchase subsidy, agricultural insurance subsidy, new rural cooperative medical care subsidy66, purchase of household electric appliances subsidy, and household biogas instruction subsidy; poverty targeting subsidy includes rural minimum living allowance, rural medical care aid subsidy, subsidy for the poor boarders’ living-cost, and exemptions on schoolbooks’ expenses and incidental expenses only for poor students before 2007.
2. Poverty targeting subsidy had a significant decrease after 2007. That was because exemptions on schoolbooks’ expenses and incidental expenses were extended to all farmers, not only the poor families. Data Source: calculated according to Table 2. The significant increase of the proportion of expenditure coupled subsidy will make more and more subsidy privileges obtained by richer farmers, which may enlarge the farmers’ income gap inside the countryside. Indeed, in present, varieties of farmers direct subsidy policies are being operated by different ministries with different aims. Only a very small part of the subsidy policies (such as rural medical care aid policy and rural minimum living allowance policy) are aimed at poverty reduction. If the synergistic effect of various subsidy polices is decreasing the benefit share of poor families, this trend should be seriously considered67.
6. CONCLUDING COMMENTS
Chinese government has been gradually implementing a number of direct subsidy policies to farmers to fulfil the “Give More, Take Less” new “sannong” development strategy. This paper conducted a primary investigation on the direct subsidy policies to farmers. We found that the direct subsidy policies implemented by Chinese central finance not only have wider and wider coverage, but also have larger and larger input scale, which contributes more and more significantly to farmers’ 66 New rural cooperative medical care(NRCMC) finance subsidy standard is the same for farmers who attend NRCMC. In that way, NRCMC subsidy is universally beneficial. However, sick farmers’ subsidy are related to the medical spending, higher medical spending with higher subsidy. Therefore, in actual operation, NRCMC belongs to expenditure coupled subsidy. Research showed that richer farmers could indeed obtain higher subsidies than poorer farmers from the NRCMC funds(Yu, Meng, Collins, Tolhurst, Tang, Yan, Bogg and Liu, 2010; Wagstaff, Lindelow, Jun, Ling and Juncheng, 2009). 67 In actual operation, more and more subsidy policies are tilting towards large landlords and rich families in terms of supporting the scale management, even including the farmers direct subsidy policy which should have been universally beneficial. For example, in Sichuan province, large landlord subsidy policy of 2014 regulates: for arable land of 30-100 mu, 40 yuan subsidy per mu; for arable land of 100-500 mu, 60 yuan subsidy per mu; for arable land of more than 500 mu, 100 yuan subsidy per mu. Subsidy policy trends in other provinces are almost similar to it. incomes and plays a role in restraining the widening income gap between urban and rural areas. If we considered the direct subsidies to farmers by regional finance which are fitted with the central finance expenditures, the effect would be even more noteworthy.
However, it should be noted that a large proportion of the subsidies belonged to expenditure coupled subsidies in the past few years, when China implemented the direct subsidy policies to farmers. Such kind of subsidy couples with the farmers specific expenditure, so the subsidy is more likely to be obtained by the rich farmers not poor or low-income farmers. Nevertheless, it is worrying to see that the proportion of expenditure coupled subsidies to direct subsidies to farmers kept increasing from 13.8% in 2003 to 38.4% in 2012, but both the proportios of universal benefit subsidies and poverty targeting subsidy were decreasing.
We agreed that direct subsidy policies to farmers have positive effects on eliminating absolute poverty, improving farmers’ income and narrowing urban-rural income gap, but we also believed that the weaknesses of Chinese direct subsidy policies above should propel policy makers to take serious about pro-poor problem in the subsidies. It does not nevertheless mean the conversion of the present direct subsidy policies to pro-poor policies, however, it is necessary to assess the pro-poor effects of farm-friendly policies on the basis of further intensifying existing farm-friendly policies and adding new farm-friendly policies. Based on the evaluation, some targeted poverty-relief farm-friendly policies should be introduced so as to make up the “weakness for poverty reduction” of universal benefit subsidy policies and expenditure coupled subsidy policies.
References
Gao, Y. and Zhao, Z.: Horizontal Collaboration for Hub-and-spoke System in Grain Industry: a
Conceptual Framework, Issues in Agricultural Economy, (03): 96-101, 2014.
Cheng, L. and Zhang, Y.: The New Rural Cooperative Medical Scheme: Financial Protection or
Health Improvement? Economic Research Journal, (01): 120-133, 2012.
Huang, J., Wang, X., Zhi, H., Huang, Z. and Scott, R.: Effects of Grain Direct Subsidy and
Agricultural Production Inputs Comprehensive Direct Subsidy on Agricultural Production, Issues in
Agricultural Economy, (01): 4-12, 2011.
Liu, K.: Analysis on the Effects and Functional Mechanism of Grain Production Subsidy Policy on
Farmers Grain Planting Decision-making Behavior: Taking Jiangxi Province as Example, Chinese
Rural Economy, (02): 12-21, 2010.
Cao, G., Zhou, L., Yi, Z., Zhang, Z. and Han, X.: Agricultural Machinery Purchase Subsidy's Effect
on Farmers' Purchase Behavior: Based on an Empirical Analysis of the Rice Planting Industry in
Jiangsu Province, Chinese Rural Economy, (06): 38-48, 2010.
Li, N. and Wan, Y.: Investigation on the Marco Policy Effect of China Machinery Purchase Subsidy,
Issues in Agricultural Economy, (12): 79-84, 2010.
Jiang, H. and Wu, Z.: Effect Evaluation for the Implementation of Grain Subsidy Policy in Miluo,
Hunan Province: Based on the Analysis of Rural Household Survey Data, Issues in Agricultural
Economy, (11): 28-32, 2009.
Zhou, Y., Zhao, W. and Zhang, X.: Evaluation on China's Recent Domestic Agriculture Support
Policies, Issues in Agricultural Economy, (05): 4-11, 2009.
Yu, B., Meng, Q., Collins, C., Tolhurst, R., Tang, S., Yan, F., Bogg, L. and Liu, X.: How does the New
Cooperative Medical Scheme Influence Health Service Utilization? A Study in Two Provinces in Rural
China, BMC Health Serv Res, 10: 116, 2010.
Wagstaff, A., Lindelow, M., Jun, G., Ling, X. and Juncheng, Q.: Extending Health Insurance to the
Rural Population: An Impact Evaluation of China's New Cooperative Medical Scheme, Journal of
Health Economics, 28(1): 1-19, 2009.
Qiu, H., Cai, Y., Bai, J. and Sun, D.: Effect of Government Subsidy on the Utilization of Biogas in
Rural China, Issues in Agricultural Economy, (02): 85-92, 2013.
Zheng, X., Jiang, Y. and Lin, T.: Will Public Subsidy for Certain Commodities Stimulate Household
Consumption? Evidence from JiadianXiaxiang, China Economic Quarterly, (04): 1323-1344, 2012.
Lin, W. and Cao, M.: Urban-rural Separation and Regional Separation Issues in Institutional Design of
the New Rural Cooperative Medical System, Issues in Agricultural Economy, (05): 40-46, 2012.
Li, M. and Shi, T.: "Appliances to the Countryside" Product's Consumers Demand Willingness and

扫描下载手机客户端
地址:北京朝阳区太阳宫北街1号 邮编100028 电话:+86-10-84419655 传真:+86-10-84419658(电子地图)
版权所有©中国国际扶贫中心 未经许可不得复制 京ICP备2020039194号-2

