The Global Financial Crisis’ Impact on the Chinese Poor By
Like in many other countries, impacts of the World Financial Crisis on Chinese economy are severe. Year 2008 was a special year for Chinese economy. It maintained a fast growth of over 10% during the first half of the year. The Chinese central government had to adopt tightened fiscal and monetary policies to prevent overheated growth and inflation pressure. However, the global economy took a sudden turn and plunge into recession in the second half of 2008. This imposed increasingly adverse impacts on Chinese economy, forcing its growth rate to decelerate. To be specific, the growth rates of several key economic indicators, such as the value-added of industry, enterprises profit, export and fiscal revenue all slid down sharply. Among all markets, labor market situation needs to give a special attention. Three groups population, namely, rural migrants, newly graduated college students, and urban low educated youth, are the groups who suffered most by the crisis. During the crisis, both urban and rural poverty are increase and their living condition are deteriorating. Fortunately, the Chinese Government acted quickly in responding to the crisis. A large scale stimulation package was applied only a few months after the crisis. Varies economic indicators were gradually improving since then. In this paper, we will focus on the impacts of the World Financial Crisis on Chinese poor. Section one studies the crisis impacts on macroeconomic situations in China. Section two deals with the crisis impacts on labor market. Special attentions are given to rural migrants and college graduates. Section three focuses on the crisis impacts on urban and rural poor. Finally, in section four, we tried to set up two models to estimate increase in number of rural poverty during different stage of crisis development.
Ⅰ. The Global Financial Crisis’ Impact on the Chinese Economy
The impacts of the World Financial Crisis on China economy started from the
forth quarter of 2008. Growth rate had declined quickly. As a result, the Chinese economy registered a growth of 9% in 2008, down by 4 percentage points from 2007.
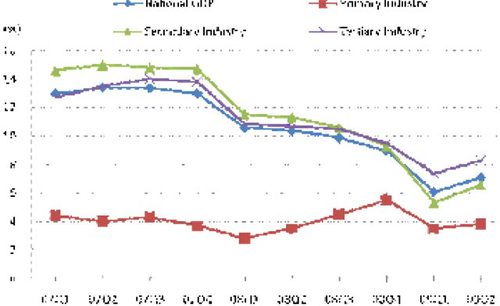
The beginning of 2009 witnessed an even worse economic environment. China’s GDP grew at a pace of as low as 6.1% in the first quarter, the worst since 1997’s Asian financial crisis. Chart 1 indicates that the growth rate of Chinese GDP as well as that of the Secondary and Tertiary industry in 2009Q1 all fell by almost a half compared with 2007Q4.
Driven by the grave economic situation, Chinese government launched a series of economic stimulating measures. In November, 2008, it unveiled an unprecedentedly massive economic stimulus package which formulated a huge investment plan of 4 trillion RMB in total. The central government alone would put in 1.2 trillion RMB for investment during the next two years. The local governments would also invest roughly the same amount of counterpart fund, while the rest of the capital coming from banks or private investment. In the meanwhile, the central government announced the plans of rejuvenating 10 key industries and pushing ahead the development of Small and Medium Enterprises. (SMEs) Besides, the central government deepens its cooperation and coordination with commercial banks. By the end of July, the amount of M2 issued by the central bank grew by as high as 28%. The banks had planned to provide new loans of around 5 trillion RMB in 2009, but the first six months alone saw new loans of 7.3 trillion RMB. All these strong stimuli pave way for China’s economic recovery. Its GDP growth rate hit 7.9% in 2009Q2, pretty close to the goal of 8% of growth rate for the whole year.
Chart 1: Chinese GDP growth in 2007Q1-2009Q2 (on a year-on-year basis)
Resource: China Monthly Economic Indicators (2009.7)
Among all sectors, China’s import and export is the sector that is hit most directly by the global financial crisis. Its import and export dependence is high above 70%, far greater than ??? in US and ??? in Japan. Charter 2 shows that the growth of China’s gross import and export value plummet since July, 2008 and becomes negative since November 2008. So far this serious trend has not been effectively controlled by the end of August 2009. The global financial crisis inflicts great losses on US, EU and Japanese people, which significantly dampens their demand for China’s import and thus causes China’s export to these countries to shrink quickly. On the other hand, the sluggish export of industrial products undermines China’s demand for the industrial raw materials in the global market, which, together with the declining import price of these materials, results in the sharp drop of Chinese gross imports.
Along with total import and export value drops significantly, the net export’s contribution to Chinese GDP starts to decline. In 2005-2007, the net export kept contributing to around 20% of GDP growth (24.1% in 2005, 19.3% in 2006 and 19.7% in 2007). However in face of the serious global financial crisis, this indicator fell to 9.2% in 2008 and kept sliding down to -2.8% in 2009Q1.1
Chart 2: China’s Total Import and Export Value between June, 2008 and June, 2009 (on a year-on-year basis)
Resource: China Monthly Economic Indicators (2009.7)
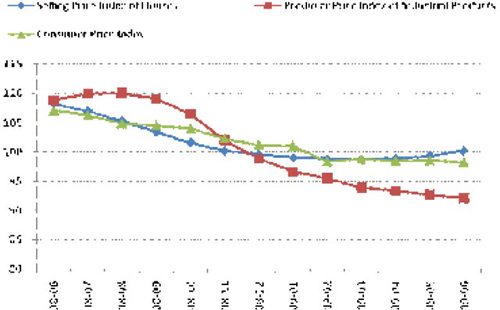
This global financial crisis also exercises adverse impact on China’s domestic consumption. Statistics show that its consumer confidence has begun to drop. Chart 3 shows that China’s Consumer Confidence Index (CCI) dips down from 94.1 to 86.5 between June, 2008 and June, 2009. Accordingly, the year-on-year growth rate of the total retail sales of consumer goods drops from 23.0% to 15.0%. Threatened by the financial crisis, Chinese people increase their family preventive saving by a large margin while curbing expending due to their expectation of declining income and worsening economic situation. Therefore, the signs of deflation gradually emerge since the second half of 2008. Chart 4 indicates that Chinese PPI (Producer Price Index) and CPI (Consumer Price Index) both falls between June, 2008 and June, 2009. In particular, the CPI decreased more notably from 108.8 to 92.2.
Charter 3: Changes of Chinese Consumption Market between June, 2008 and June,
2009(on a year-on-year basis)
Resource: China Monthly Economic Indicators (2009.7)
Charter 4: Changes of Major Price Indexes in China between June, 2008 and June,
2009 (on a year-on-year basis)
Resource: China Monthly Economic Indicators (2009.7)
Since the global financial crisis seriously undermines China’s real economy, the government fiscal revenue has been negatively affected since the second half of 2008. Except for December, 2008 when China’s monthly revenue increased by 3.3% on a year-on-year basis, the other months all witnessed negative growth from Oct. 2008 and April, 2009. This situation has not effectively addressed until May, 2009 (See Chart 5). At the same time, Government expenditure kept increasing, particularly notably in 2008Q4 and 2009Q1. This happens because large amounts of Chinese enterprises come across great challenges due to the financial crisis and are even forced to go bankrupt. So the taxes from these enterprises and their employees are bound to decrease. The policy of massive tax and fee reduction and exemption is another reason for the shrinking fiscal revenue. In addition, since the fiscal revenue is calculated based on the present value, the drop of CPI and PPI caused by the economic recession also results in the shrinking revenue. On the other hand, the central government channels large amounts of investment into infrastructure and social protection mechanism in the second half of 2008, in the hope of countering the macro-economic cyclical downturn. This inevitably leads to the soaring of government expenditure. Nonetheless, the expanding fiscal deficit is still within the acceptable range of what China’s overall national strength can bear.
Chart 5: Changes of Chinese Fiscal Revenue and Expenditure between June, 2008 and June,
2009 (on a year-on-year basis)
Resource: China Monthly Economic Indicators (2009.7)
Ⅱ. The Financial Crisis’ impact on Employment
In addition to the real economy, Chinese labor market is also seriously impacted by the global financial crisis. Migrant workers and college graduates are the
population that is hit most seriously and directly.
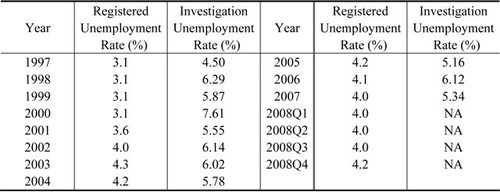
According to the Chinese government, the registered urban unemployment rate keeps declining since 2003. However, it increased from 4.0% to 4.2% in 2008 and 4.3% in 2009 Q1(see table 1). Since the employment of migrant workers and the urban informal sector and self-employed who are not covered by the social protection system, they are not taken into consideration in the registered urban unemployment rate. The real unemployment rate is bound to be far higher than the registered one. In this case, investigation unemployment rate which is calculated through employment survey system is more likely to reflect the real situation. Generally speaking, the investigation unemployment rate is higher than the registered rate by one or two percentage. However, since the investigation unemployment rates in 2008 and 2009 have not come out yet, it is hard to use this index to quantify the financial crisis’ impact on employment.
Table 1: China’s Urban Registered Unemployment Rate and Investigation
Unemployment Rate (Unit: %)
Resource; The registered unemployment rates come from China Labor Statistical Yearbooks
The investigation unemployment rates between 1997-2004 and 2006-2007 are calculated from the statistics in China Statistical Yearbooks and China Population Statistics Yearbooks. The investigation unemployment rate in 2005 is calculated based on the micro-data of 1% sample population survey in 2005. (Cai Fang , 2009)
Several scholars claim that the real situation of urban unemployment is much worse than what is indicated by the registered unemployment rate and even the investigation rate. According to the relationship between export and economic performance as well as employment, Cai Fang and Wang Meiyan estimated that the urban investigation unemployment rate, which excludes the migrant workers, might hit 6.3% in 2008. (Cai & Wang, 2009)
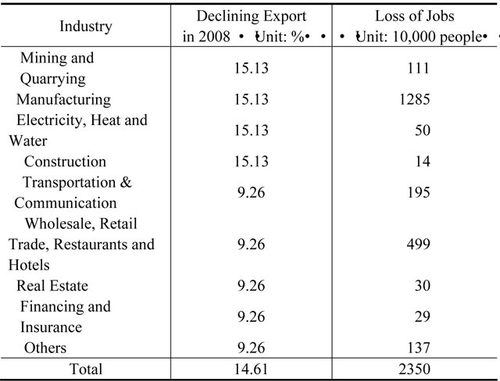
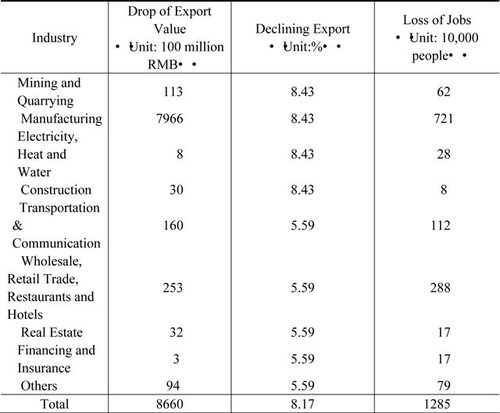
Zhang Huachu, Cai Fang and Wang Dewen (2009) use the input-output table to calculate how much the plummeting import and export could affect Chinese labor market. Their studies indicate that in 2008, the shrinking export in various sectors result in the loss of 23.5 million non-agricultural jobs, roughly 5.2% of the total number in 2007. In consideration of the fact that there are only 11 million new jobs created in cities and towns, it is clear to see how seriously the labor market was hit by the drop of import and export. Although the government launches the expansionary monetary and fiscal policies in 2009, Zhang, Cai and wang estimate that since the export is still declining, this could incur the loss of another 13.32 million urban job opportunities.
Table 2: The Drop of Export and Loss of Jobs in Different Industries in 2008
Resource: Zhang Huachu, Cai Fang & Wang Dewen (2009). The drop of export is calculated based on the trend of export growth in 2003-2007.
Table 3: The Drop of Export Value and the Loss of Jobs in Different Industries in 2008
Resource: Zhang Huachu, Cai Fang & Wang Dewen (2009). The drop of export is calculated based on the trend of export growth in 2003-2008.
Two groups of people deserve particular attention among the unemployed people, i.e. migrant workers and new college graduates. They are hit more severely than others because of their roles in the economic activities as well as their age. (Cai Fang et.)
The growth of Chinese migrant workers is closely tied up with China’s reform and opening-up as well as its urbanization. (Stearman,2008)During the past two decades, Chinese migrant workers have become an indispensable component of the workforce. From 2000 to 2008 alone, the number of migrant workers expands by 79%. The huge income gap between the rural and urban areas makes the agricultural production less and less attractive for labors. The improved agricultural productivity also produces large amount of rural surplus labors while the massive urbanization and industrialization in cities give rise to huge demand for labors. By the end of 2008, there are altogether 225.42 million migrant workers. Among them, 140.41 million of
them find jobs outside of their villages, accounting for 62.3% of the total, and 85.01 million of them work in local enterprises, account for 37.7%. The majority of the migrant workers, around 63%-79% of the total, flow to the Eastern China because on the one hand, this area is crowded with labor-intensive enterprises and maintains a brisk and huge demand for migrant workers, and on the other hand, the higher average salary in this area makes it more attractive for migrant workers.
Chart 6: The Flow of Chinese Migrant Workers and Its Changes in 2003-2008
Resource:CAI Fang, WANG Meiyan, QU Yue. Industrial and labour relocations among Chinese regions. http://adbi.adb.org/files/2009.06.18.cpp.sess2.cai.industrial.labor.relocations.chinese.p df
The current crisis curbs the consumption of China’s major trading countries. So many Chinese enterprises lose a lot of foreign orders. The export-oriented manufacturing enterprises in Southeast China were the ones hit most directly by this. Since most of them are labor-intensive in nature and hire mainly migrant workers, the loss of foreign orders makes their situation deteriorate continuously. Due to the lack of labor unions to protect migrant workers’rights and low cost of firing them, many enterprises fire lots of migrant workers to reduce their production cost. In addition, Migrant workers have not accessed to the urban social protection system, such as unemployment insurance enjoyed by their urban counterparts. (Xu Bin 2009) Consequently once they lose their jobs, they have no choice but to go back to rural areas.
Since there are no detailed and regular statistics for the employment of migrant workers, we have to observe the changes of their employment through varies surveys. (Xinhua, 2009) Migrant workers usually come back home around the traditional Spring Festival, so it is apparently unusual to see large number of migrant workers back home long before the Spring Festival.
(1)According to the Ministry of Human Resources and Social Security, around 4.85 million migrant workers go back home before October, 2008, accounting for 5.4% of the total.
(2)Another survey of the Ministry of Agriculture shows that by the end of October, 8.45 million migrant workers, 6.5% of the total, return home.
(3)When it comes to December, the National Bureau of Statistics observes over 10 million return home, accounting for 10% of the total. In January, 2009, the Ministry of Agriculture announces that 38.5% of the migrant workers return home, reaching 53.9 million people. It is worth noting that there must be large amount of people returning home in January because of the Spring Festival which is in January. Relevant surveys show that 39.6% of these 53.9 million migrant workers, roughly 21.34 million people, come back home long before the Spring Festival because they lose their jobs or fail to find jobs.
(4)The latest survey indicates that 95% of these workers go back to work in cities after the Spring Festival. This means that 5% of them select to find local jobs or create their own business in local towns (Wang Yadong, 2009).
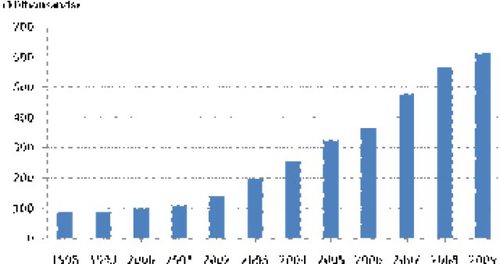
Chart 7: The Number of Chinese College Graduates in 1998-2009
Resource: Ministry of Education of the People’s Republic of China
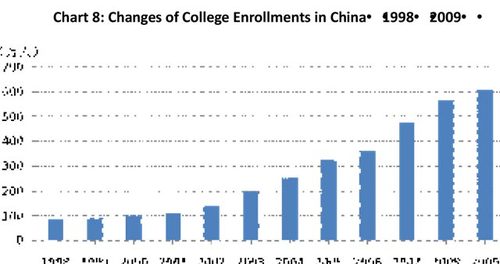
Aside from rural migrants, an increasing trend of unemployed college graduates has been generated a great attention in recent years. China started its expansion of college enrollments program since 1998. Since then, college enrollments increased drastically. From Chart 8 we can see that within 11 years, college enrollments for 4 year college students increased from 0.876 million to 6.11 million, increased by 7 times.
Source: Ministry of Education
While the expansion of university has provided a lot of opportunities for the student entering college, it also creates pressures on job opportunities. In the past a few years, millions students could not find a job before they left university. Unemployment rate for the college graduate usually reached about 30% upon graduation. It would be reduced to about 10% after 6 months of the graduation. Unemployment of college graduates have become a big issue even before the financial crisis.
The job markets for college students have been further deteriorating after the financial crisis. Just like in many countries, the most financial institutions and high tech companies, which usually hire a lot of college students, have stopped to recruit new staff after the crisis. Manufacturing and service industries also reduced their labor force because of lack of demands. Many schools reported that, by May of this year, graduates who signed employment contract had less than 40%.
Government makes a big efforts to help the graduates to find a job. Some jobs were created specifically for college graduates in townships and communities organization in urban areas. It also provided some incentives by local Government for enterprises which hire the graduates. Since meddle of the year, the Government has also implemented a policy to encourage enterprises to provide internship trainings for those could not find a job after graduate more than half a year. The Government provides allowances for the students.
With all those efforts, employment situation for the graduates this year is slightly better than a year before in spite of the negative impacts of the financial crisis in 2009.
Ⅲ. The Global Financial Crisis’ Impact on the Poor
3. 1. The relationship between rural poverty and growth of net income
Ever since China successfully carries out its reform and opening-up policy, its economy grows at a remarkable pace, which significantly reduces the size of poor population while improving the living standards of rural and urban people. No matter what standard is applied, the number of rural poor decreases by a large margin during the past three decades. According to the poverty line defined by the Chinese government1, China had 250 million rural poor people in 1978 and this number was reduced to 23.65 million in 2005. The poverty incidence decreases from 31% to 2.5%(Poverty Monitoring Report of Rural China, 2008). Even when a higher standard is adopted, such as the poverty line of $1/person/day proposed by the World Bank, the number of Chinese poor people and its poverty incidence both drop significantly2.Before China’s reform and opening-up, its poverty incidence was high above the international average level due to its poor economic development and deficient economic system. However, now is the totally different case (Chen & Ravillion,2008). The government successfully implemented the strategy of development-oriented poverty alleviation and promoted the poor areas to improve their culture, education and public health. China’s remarkable achievement in povertyalleviation has gained the widespread acknowledge of the international community, thus becoming the yardstick for many developing countries.
Chinese remarkable achievement in poverty alleviation is mainly thanks to its fast economic growth and positive anti-poverty policies. During the past three decades, China’s fast economic growth significantly reduces the number of rural poor people. In 1978-2005, the rural people’s net income per capita increases by 525% in real terms with the annual growth rate of 6.6%. At the same time, the number of rural poor people decrease from 250 million to 23.65 million according to the survival poverty line, with an average decrease of nearly 9 million every year.
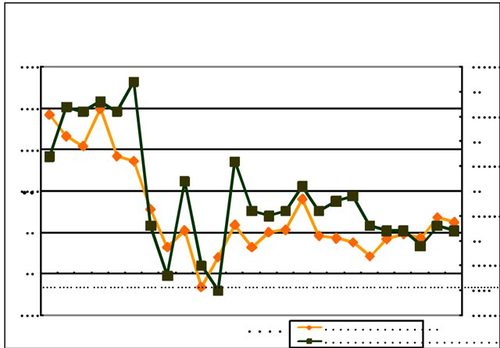
Chart 9 depicts the correlation between the growth rate of rural net income per capita and the decrease of rural poverty incidence. The high growth rate of rural net income per capita correlates with the falling rural poverty incidence before 1985. On average, when the economic growth rate was over 10%, the poverty incidence in that year decreased by around 2%. Between the late 1980s and the middle and late 1990s and the Asian Financial Crisis period, the peasants’income fluctuated significantly while the decrease of the poverty incidence underwent similar changes. During those period, the average net income growth rate was less than 3% in several years. Accordingly, the poverty incidence decreased negligibly and even rebounded sometimes. In conclusion, enhancing the pace of rural economic growth and increase the peasants’income quickly and significantly play a crucial role for alleviating the rural poverty.
Chart 9: The Correlation between the Growth of China’s Rural Net Income
Per Capita and the Decrease of Poverty Incidence in 1979-2005
Resource: China Statistical Abstract 2006
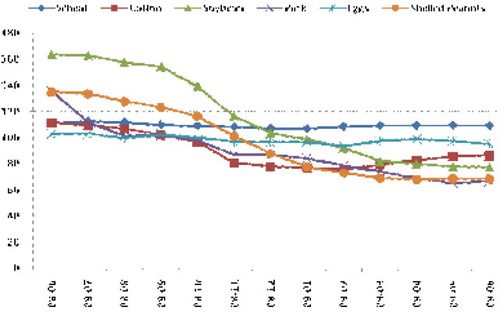
The current world financial crisis’ impact on poverty in China is initially demonstrated from peasants’declining income growth. Since the crisis causes lots of global wealth to evaporate, the global demand for agricultural products begins to contract in the second half of 2008. The price of agricultural products was forced to fall in the global market and then negatively impact their prices in Chinese domestic market through international trade. In the meanwhile, Chinese people’s demand for agricultural products turned sagged. The domestic prices of most agricultural products began to slide down in the second half of 2008. Chart 10 indicates that in the second half of 2008 and first half of 2009, the domestic price of agricultural products all declines, particularly non-staple food such as soybean, cotton, pork and peanut kernel. Statistics show that 50% of Chinese peasants’income is mainly from agricultural planting. The sharp decline of the agricultural products’price in a short period of time seriously affects the income of peasants, particularly low-income peasants, and further prevents them from improving their living conditions. ( Zhang T. and Wang Hengzhi ,2009)
Chart 10: The Price Indexes of Major Agricultural products between June, 2008 andJune,
2009 (Same Month Last Year =100)
Resource: China Monthly Economic Indicators (2009.7)
3. 2. The Relationship between Migrant Workers Unemployment and Poverty
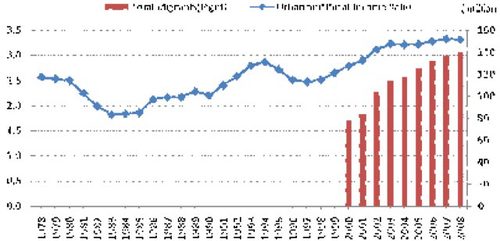
Another crisis’ impact on poor people is that it poses great difficulties for migrant workers’employment and income. Chart 11 shows that farmer’s per capita income is closely related to total number of rural migrants who find a job in urban areas. The burst of this crisis seriously affects lots of export-oriented enterprises in the Eastern China. Around 40% of the export SMEs in coastal areas are forced to close temporarily. (Zheng Bingwen, 2009) Thus lots of laid-off migrant workers find it particularly hard to get new jobs during this period of time. It has adverse impact on the poor in the country.
Chart 11: The Ratio of Rural and Urban Income Per Capita and the Number of Migrant Workers in 1978-2008
Resource: CAI Fang, WANG Meiyan, QU Yue. 2009
The majority of the migrant workers are excluded from the unemployment insurance system. So once they lose their jobs, their living conditions, which are already pretty vulnerable, will deteriorate immediately. In addition, the elder and poor-educated migrant workers are more likely to lose their jobs. To make matters worse, they are mainly from the poor families. So their unemployment might put the whole family back into poverty.
Lots of young migrant workers go to cities for a living as soon as thy graduate. So they have neither the skills for agricultural production nor the willingness to go for it. Comparatively speaking, they are more used to the living styles in cities when they spent more time living and working there. Of all the 140 million migrant workers in China, such of youngsters below the age of 30 account for 52.6%. Among them, about 82.9% have only junior higher school or below education background. In the job market, the lower of your education background, the easier to loss job during a period of mass laid-off. Therefore, the worsening economic situation will surely inflict poverty on lots of laid-off young migrant workers.
3. 3. Impacts of Unemployed College Graduates on the Poverty
About 50% college students come from rural area and many of them from poor families. As China has yet established an effective student loan system, many poor families have to send all their savings and income and, sometimes borrow from their relatives to pay for the tuitions for their son or daughter.
Among the unemployed college graduates, for those come from rich and middle income families, they could get some supports from their family to pass this difficult periods. But for those unemployed college graduates come from poor families, financial pressure would become more severe than a normal student. It could also drive he/her family to return to the poor. A national survey data shows that students come from rural area have a much higher unemployment rate. For example, for the graduates from 4 years’college, the unemployment ratio is 50% higher for students from rural area than those from urban area. Therefore, the negative impacts on the unemployment of college graduates could have more impacts on rural poverty.
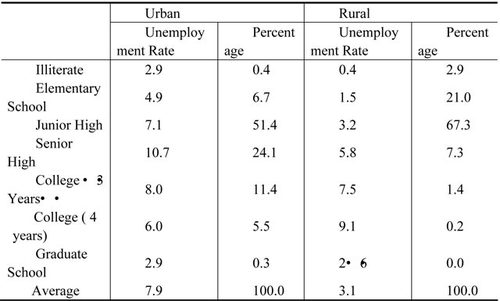
Table 4: Unemployment Ratio for the Urban and Rural Students
Unit:%
Source:2005 National 1% Survey Data , National Bureau of Statistics
3. 4. Impacts of the Crisis on Urban Poverty
General speaking, because of the most urban poor has covered by Urban Minimum Living Standard Supporting System, the crisis impacts on urban poverty is not as severe as that in rural areas. However, special attention has to give to a group of yang people who has only received a high school or below education. Those group of yang people can not find a job in high end market. Also they cannot compete with rural migrants in the low end market. Therefore, the unemployment rate of this group is very high. Table 4 shows that those group people in the urban areas have a much high unemployment ratio compared with their counterpart in rural areas. For example, the unemployment rate of senior high school students is 10.7%, which is more than doubled compared with students who have a similar education background in rural area. As many of those yang people from poor family in urban areas, its negative impacts on the poor families cannot be underestimated.
IV.Estimation of the Crisis on the Rural Poverty in China
As poverty data is published usually a few years behind, there is no official data on the change of poverty situation after the crisis. We develop a model and try to estimate quantitatively the increase of rural poverty in the past three quarters.
Our model based on an assumption that the two main factors influence of rural poverty are net income and employments of rural migrants. We use income based the Government’s low income data ( 865 RMB per person per year based on 2000 RMB or 1067 RMB based on 2007 RMB )。 Based on this poverty line, by 2000, the rural poverty number in China wa 62.13 million. This figure reduced to 28.41 million by 2007. On average, 1.2 million reduced every quarter. In 2008, Chinese Government readjusted poverty line again. The new poverty line increased to 1196 RMB. Under this new poverty line, the number of the rural poor was 40.07 million. However, since we do not have historical poverty data based the new poverty line. In this paper, we are still use the poverty data based on 865 RMB ( in 2000). We also use quarterly data of rural cash income as a proxy of net income and number of rural migrants who find a job out of their home township. The data started from 1997 up to 2005.
Model One:
LowincPOV = 10572.9 – 3.0467x INC – 0.0528 x LAB
t = (81.41495) (-22.85441) (-2.120761)
R2=0.992119
F-stat=1573.566
DW-stat=1.801498
LowinPOV=Rural Low Income based per day, 2005 PPP)
INC=Rural Quarterly Real Net Income with seasonal adjustment
LAB= Number of Rural Migrants who worked out side of their hometown
Using the Model One’s result, we tried to estimate changes of number of rural poverty after the crisis. According to data collected by the National Bureau of Statistics, rural cash income decreased by 1.7% in the 4th quarter of 2008, and increased by 3% and 4.75% in the first quarter and second quarter of 2009, respectively. We also used varies employment surveys by the National Bureau of Statistics on rural migrants in the past a few quarters.
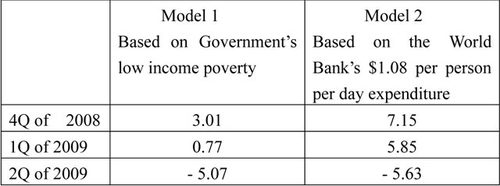
Based on all of those data, the Model One shows that compared to the third quarter of 2008 when the financial crisis had yet influenced Chinese economy, number of rural poverty increased by 3.02 million in the 4th quarter of 2008. By the First quarter of 2009, situation had become a little better. Poverty number increased by only 0.77 million compared with the third quarter of 2008. By the end of the second quarter of 2009, largely because of Government’s stimulation package, economic growth rate again maintained a reasonable rate of growth, farmer income and employment opportunities for the rural migrants were all improving.. Our estimation shows that the rural poverty returned to the decline trend. Total rural poverty reduced by 5.07 million compared to the third quarter of 2008.
In the model two, we use World Bank’s $1.08 per day per person consumption as poverty line. (1993 based). According to the World Bank’s data, by 2000, rural poverty ratio was 38.64%, or 311.9 million rural population was under poverty. This figure reduced to 18.44% or 137.1 million of rural poverty in 2005. The World Bank has not published its poverty estimation after that. We estimate according to the trend of poverty reduction, by the end of 2007, rural poverty ratio was 16.73% or 122.1 million rural population was still below the World Bank’s poverty line.
Model Two shows our estimation results based on the World Bank’s poverty line:
t= (6.199052) (-2.286439) (-1.533899)
R2=0.952196
F-stat=179.2692
DW-stat=2.068206
POV=Rural Poverty Ratio based on $1.08 per capita per day, 2005 PPP)
INC=Rural Quarterly Real Net Income with seasonal adjustment
LAB= Number of Rural Migrants who worked out side of their hometown
Based on our Model Two regression results, we estimate that in the last quarter of 2008, due largely to the crisis impacts, rural poverty ratio measured by the World Bank’s poverty line increased by 0.99 percentage point or about 7.15 million compared to the third quarter of 2008 when the impacts of the financial crisis was still very minimum. By the first quarter of 2009, the poverty ratio was still 0.81 percentage point or 5.85 million higher than that of the third quarter of 2008. The poverty ratio declined only after the second quarter of 2009. Consequently, the poverty ratio that we estimated decreased by 0.78 percentage point, or 5.63 million less than that of the third quarter of 2008.
Table 5. Increase Number of Poverty Compared to 3Q of 2008
( Unit: million)
Source:Estimated by authors of this paper
V.Conclusion
The World Financial Crisis has imposed increasingly adverse impact on Chinese economy through sharply dropping of exports and imports, decelerating of economic growth and sliding in fiscal revenue. As a result, unemployment rate increased particularly for the rural migrants and college graduates. Both rural and urban poor are very vulnerable for the slow down of economic growth and increase of unemployment. More severe situation is mainly for the rural migrants and college graduates as they are the group of people who beard the main burden of the crisis. The unemployment rate of urban yang people with lower education background has also experienced high unemployment rate.
Poverty deteriorated during the first two quarters of the peak period of crisis in the end of 2008 and early 2009. Our estimation shows number of the rural poverty increased by 3 to 7 million and 0.8 million to 5.9 million, in the forth quarter of 2008 and first quarter of 2009, respectively based on different poverty lines.
Fortunately, the Chinese Government implemented a large scale stimulation package a few months after the crisis. Those measures played an important role to reduce the adverse impacts of the crisis. Economic stimulate policy has boosted economic growth and promoted employment. Social protection policies implemented by the Government have also helped the vulnerable groups. Poverty situation improved and backed to the long term downward trend in the second quarter of 2009 and likely continue in the rest of the year.
Reference
Cai, Fang, d. Yang, & Wang,DW, (2009) A Study on Issues of China’s Education Reform and Development Strategy, in Report on China’s Pupulation and Labor No.10, Social Sciences Academic Press, 2009. 8.
Chen, Shaohua, Martin Ravallion. (2008) China is poorer than we thought,but no less successful in the fight against poverty. 2008.5
Stearman. K (2008) China’s Migrant Workforce-A Special Report. Sam’s China Business Advisory (Special Report)
Xinhua. (2009) China pledges more proactive employment policy, 42 bln-yuan support[OL]. 2009-03-05
Xu Bin (2009) From a Sociology Angle to Understand the Trend of Migrants Return Home under the Financial Crisis Impact People’s Daily Network; http://politics.people.com.cn/GB/30178/8866423.html
Zhang Hua chu, Wang Dewen, and Cai Fang, (2009) An Analysis on Employment Effictiveness of Domestic Stimulus Investment, in Report on China’s Pupulation and Labor No.10, Social Sciences Academic Press, 2009. 8.
Zhang Tuo, Wang Hengzhi (2009) Difficult of Migration Education during Inter-generations changes People’s Daily Net ,2009-08-03
Zhou Tian Yong (2009) Macro Control Objectives and Policies need to be major adjustment – Rethinking of Current Economic Situation and Phasing out of Macro Control in China China Economic Time, Feb 11, 2009
Zheng Bingwen (2009) , Expand Social Security Coverage: International Experience , 2009-04-28

扫描下载手机客户端
地址:北京朝阳区太阳宫北街1号 邮编100028 电话:+86-10-84419655 传真:+86-10-84419658(电子地图)
版权所有©中国国际扶贫中心 未经许可不得复制 京ICP备2020039194号-2

